The TL;DR* of this article
*Too Long, Didn't Read

- Beginner
- Intermediate
- Advanced
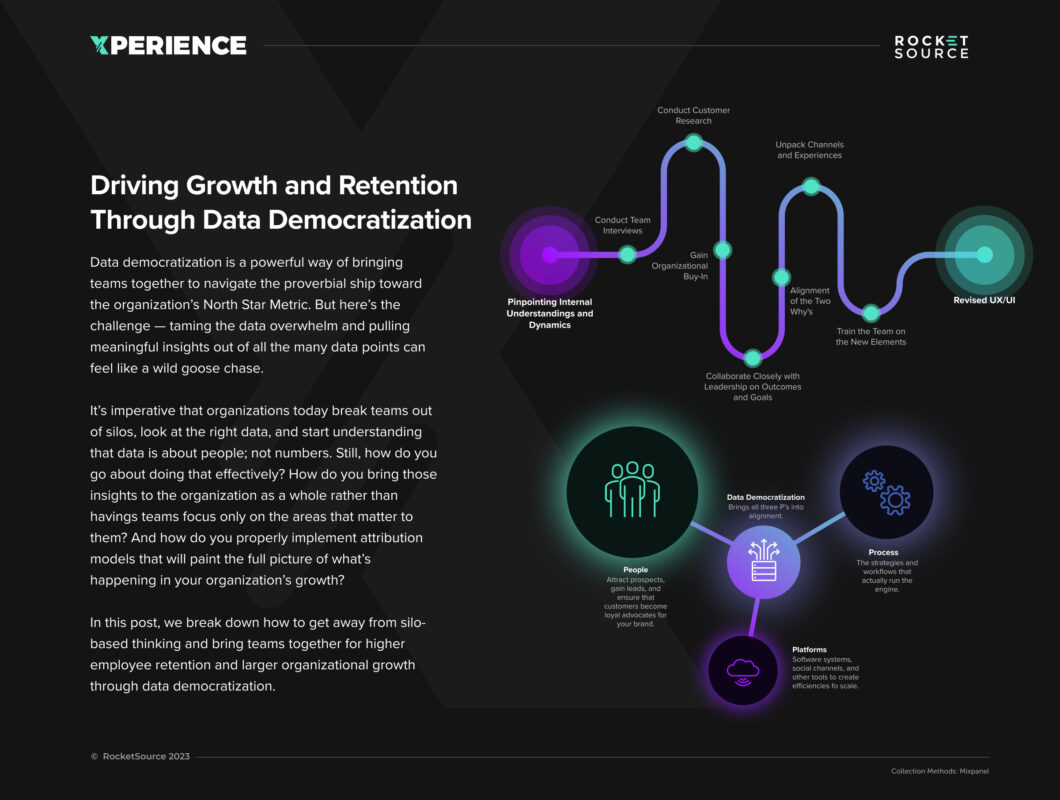
Post Summary
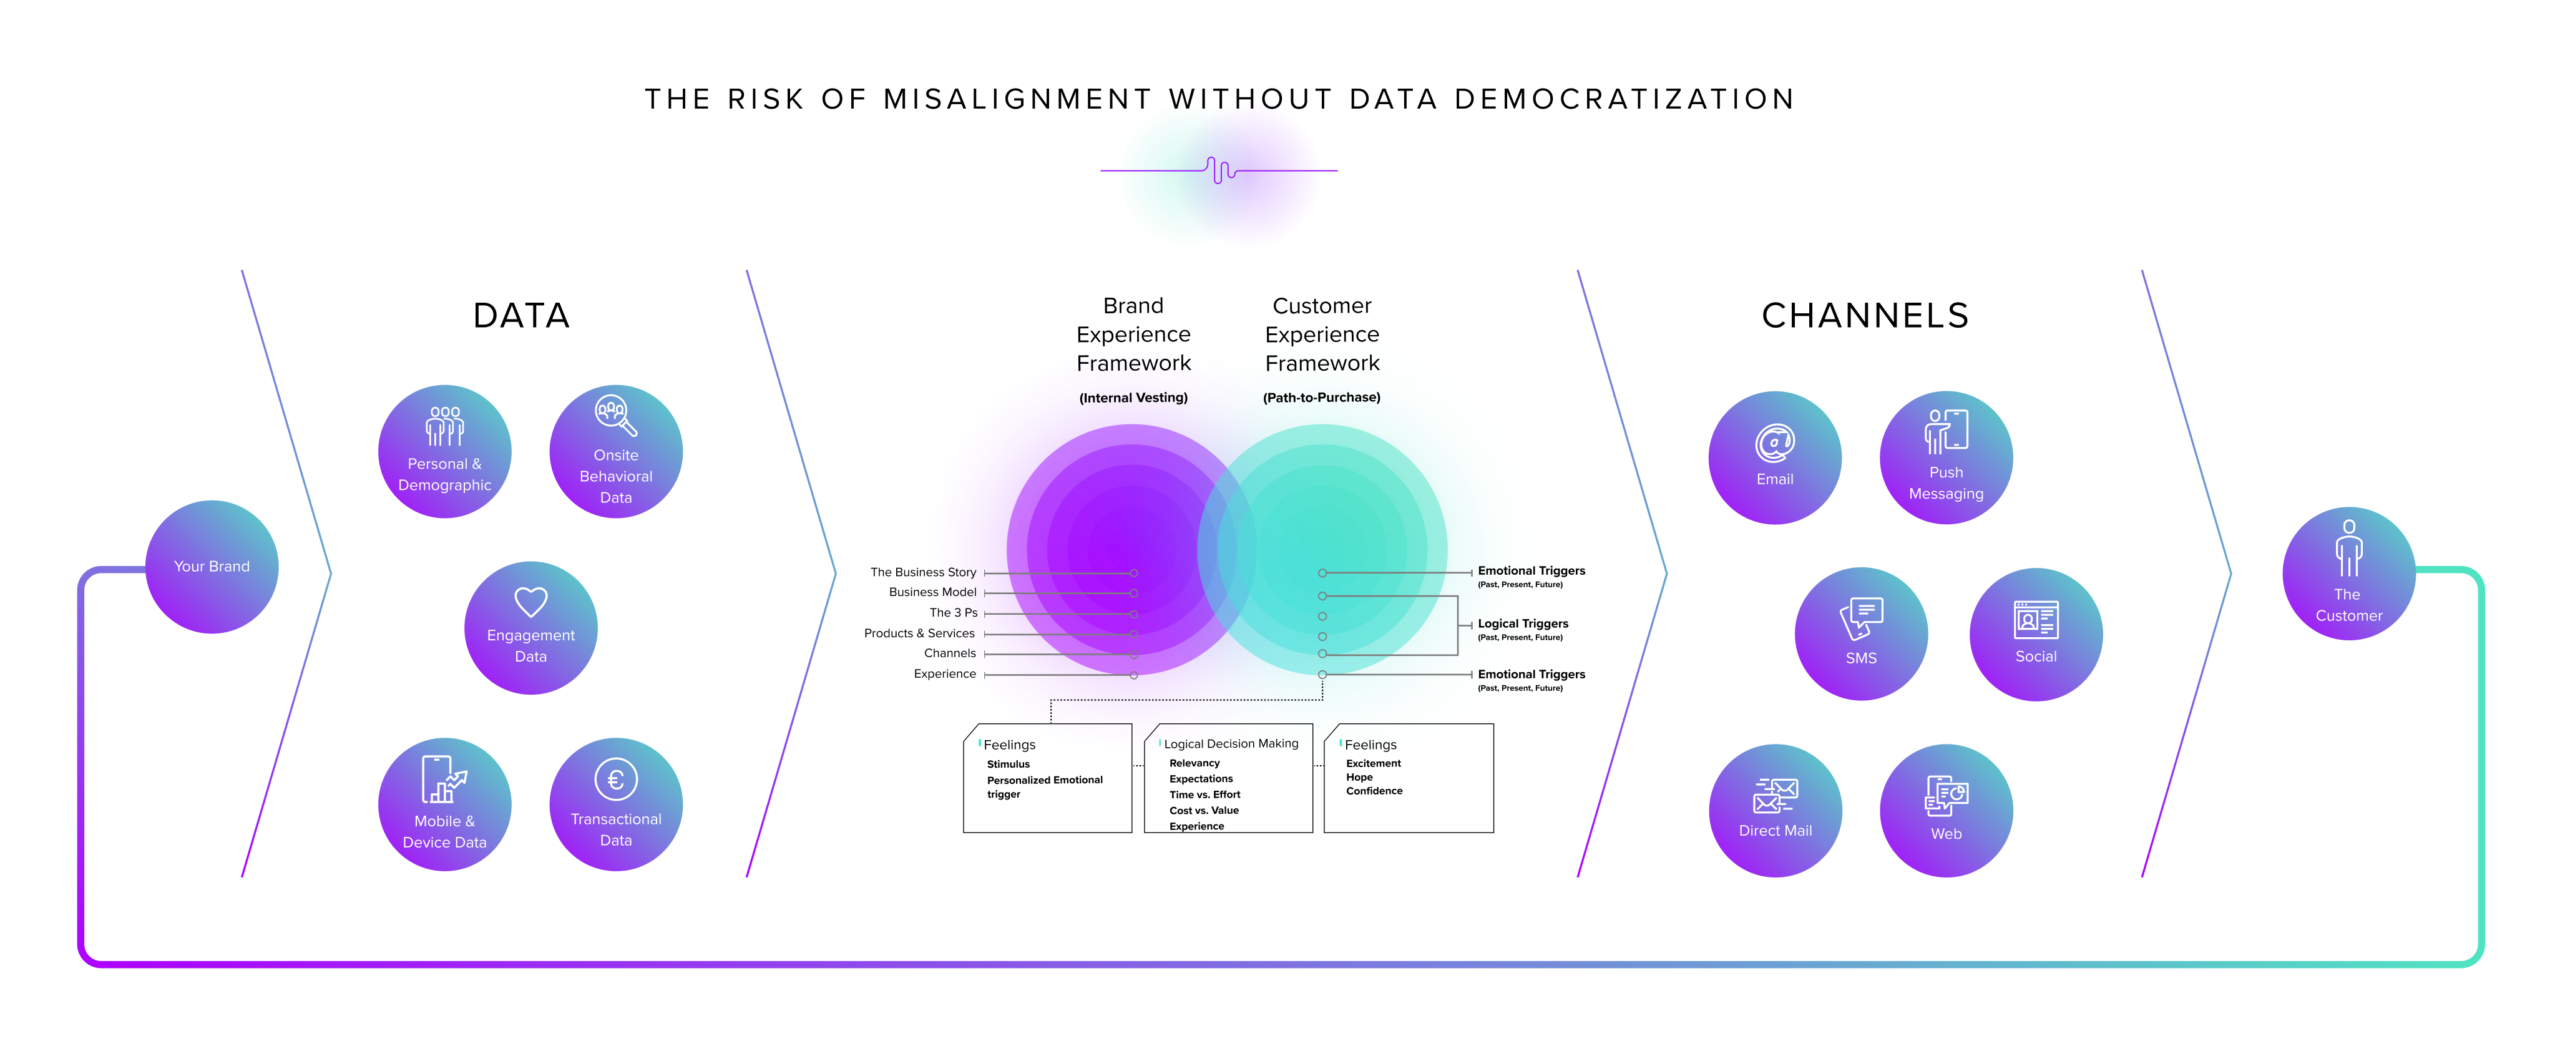
Misalignments Without Data Democratization
Silo-based thinking, looking at data through the wrong lens or even just looking at the wrong data can cause misalignments across the team and within the experiences delivered.Using a Framework to Democratize Data Sets
Understanding how to democratize data sets requires looking at the type of data to analyze and share, as well as a framework for how to disseminate insights across the organization.Data Democratization Settles Attribution Issues
Attribution issues can wreak havoc on CX and EX strategies. Data democratization helps mitigate that risk and bring teams closer together.Data Democratization Builds Retention Internally and Externally
From internal team alignment to a more in-depth and cohesive understanding of the customer experiences, data democratization builds retention efforts.

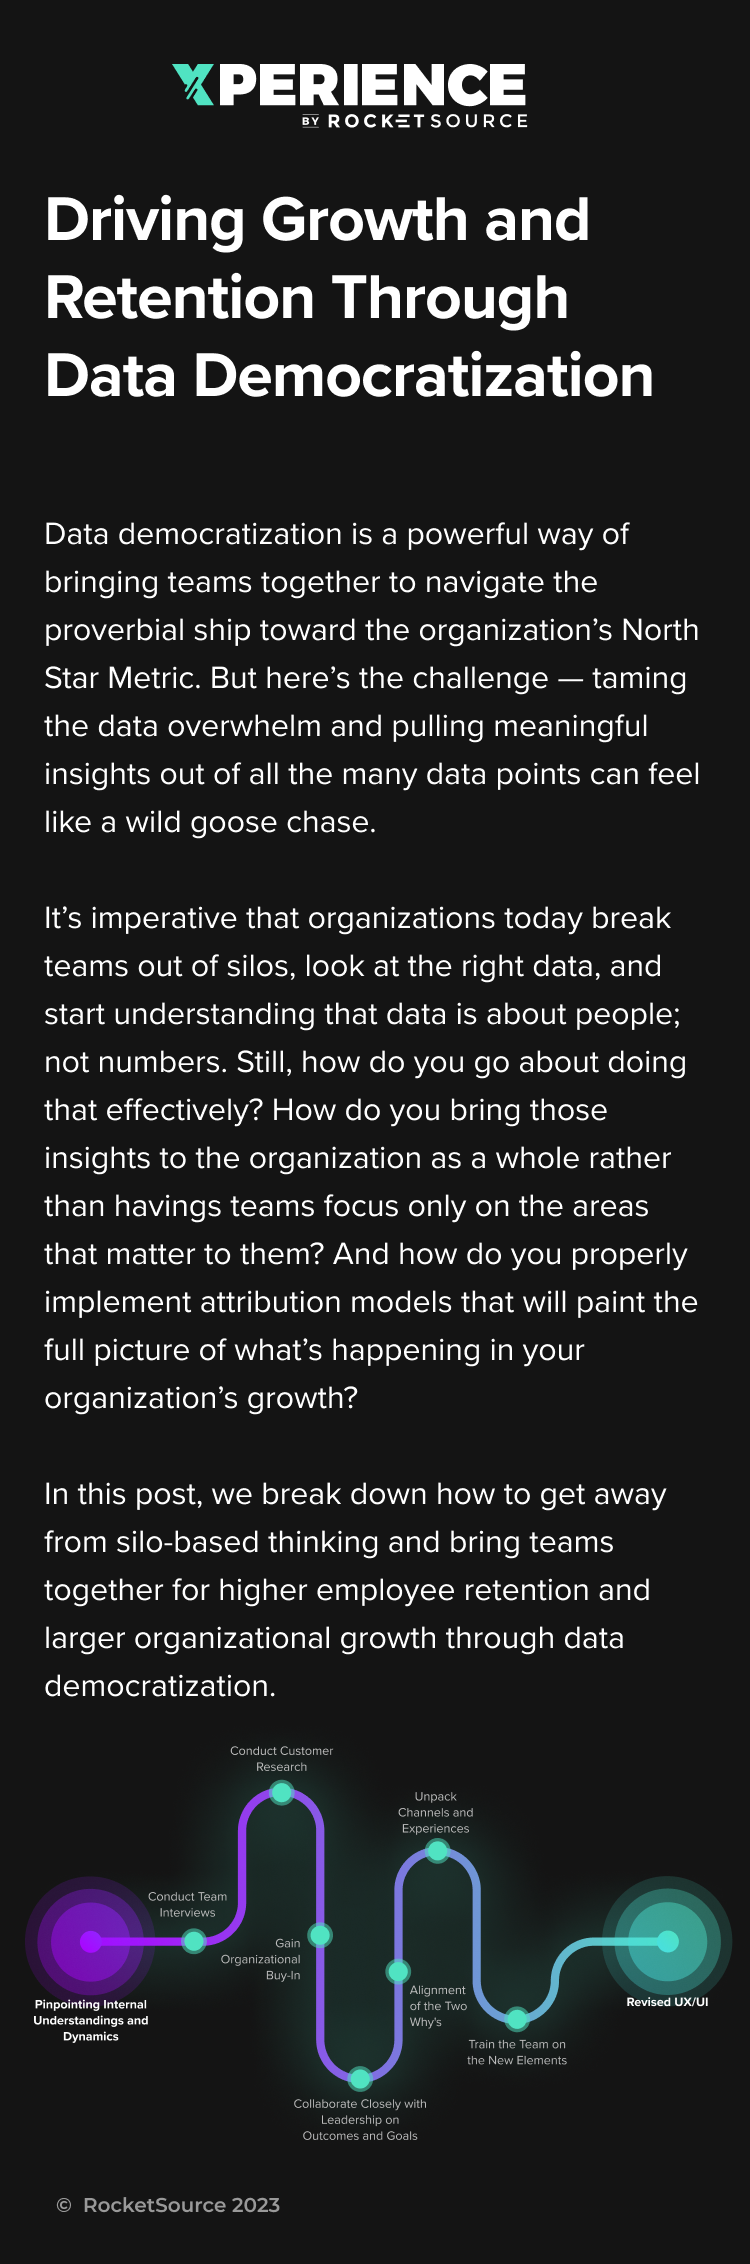
Much like the James Webb telescope has cracked open a whole new understanding of the universe we live in, data democratization is the clarifying tool that’s critically required to truly tap into the power of an organization’s constellation of North Star Metrics. Much like a telescope, plenty of technology is available at an organization’s disposal to sharpen and bring into focus what’s happening beyond the corporate walls. However, with big data comes big problems, especially when teams fail to leverage and act on the “interstellar” insights to unlock viable growth and retention opportunities far beyond the quarter in the queue.
This failure to act has made navigating the steep S Curves of Growth difficult. Knowing which data points will hold the answers, how to model the right data for the right insights and how to leverage that data for growth can feel overwhelming. Worse yet, the consequences of getting these areas wrong are dire — a term we don’t use lightly.
The need for democratizing the right data to your teams is that serious, and you may be on the verge of some pretty catastrophic corporate events if you’re feeling the pinch in any of these areas:
- Revenue is down while costs continue to skyrocket
- The cost of acquisition keeps going up while the lifetime value of each customer starts to decrease
- Employees are quitting, seemingly out of nowhere
- Layoffs are happening, and no one in the organization seems to have a solution to stop the bleed
Knowing how to fix these symptoms requires knowing the root cause behind why they’re happening in the first place. And here’s the thing:
Chasing the wrong data can lead to firing the wrong people and even crashing a stock.
It’s that serious. Yet, organizations across the board struggle to find alignment on the metrics that matter and instead constantly battle channel conflict, cannibalization and attribution mysteries. Channel conflict can send teams to implement different strategies based on their own unique set of metrics they’re tracking. As a result, teams cannibalize each other by overlapping their efforts, competing for budgets and credit, and focusing too much on short-term wins that took like success rather than long-term efforts to simultaneously acquire new customers while retaining existing ones. When looking closer at where to focus time, talent and resources, attribution errors from different teams using different definitions for Customer Acquisition Cost (CAC) and other critical growth metrics creating even more chaos and confusion. Before you know it, everyone is operating from a different page, looking at the wrong or outdated data and becoming paralyzed by inconsistencies.
Amidst this chaos, how do you define growth? Revenue growth may not always mean profitable growth. As we saw from the Mount Erebus disaster, even a small shift in course can lead to catastrophic outcomes. One small miscalculation could come from incorrectly conflating Return on Ad Spend (ROAS) with Return on Investment (ROI), or CAC with Cost Per Action (CPA) or Average Cost of Sale (ACOS).
To help bring teams back together, we often argue that organizations need to think like startups, specifically when it comes to revenue. In a startup, teams work cohesively in lockstep out of necessity. As companies grow, teams tend to get further away from the organizational goal and are closely tied to their departmental goal. Rather than everyone working toward revenue growth, teams work toward earning their next commission check, getting credit for new customers, and presuming customer retention as a given. Ask around the sales, marketing, or development teams about the role legal and IT play in revenue growth, and you’ll be met with light answers or head scratches. Marketing might say, “the sales team wouldn’t have a product to sell or any leads to call without us, so why should they get all the credit?” On the other hand, the legal team might claim that the company couldn’t survive without them. Meanwhile, the sales team takes direct credit for all of the new revenue brought in throughout the year.
As a company, when your organization is on a downward inflection, it can feel like you’re in a plane heading into a mountain at break-neck speeds. How do you stop, especially when trusting the wrong data can mean the difference between slamming into the mountain or reaching your destination? For your organization, this can be the difference between hitting growth targets, or finding yourself in the company of now defunct giants, such as Blockbuster.
Feeling nervous yet about the current temperature of your organization’s ability to democratize data in a way that continues to move you up the S Curve of Growth? You’re not alone, especially given today’s current macroeconomic backdrop.
Data Democratization is Critical in Today’s Climate
Macroeconomics in today’s world play a critical part in how organizations are perceived, navigate the market and continue to grow. But are macroeconomics an invisible hand, or are they driven by a systemic failure to properly capture, evaluate and take action on the right data? As evidence, look at the tens of thousands of people recently laid off in Silicon Valley alone. And speaking of Silicon Valley, it’s hard to talk about the macroeconomic backdrop without mentioning the dramatic collapse of the Silicon Valley Bank. These and other problems aren’t isolated to Northern California either. Inflation is impossible to ignore. Organizations are facing paralysis as to where to allocate their available cash. Meanwhile, teams face more scrutiny, larger budget cuts and leaner operations as manpower gets reduced.
The enormity of these events begs the question:
How will the current macroeconomic backdrop affect operations down the line?
To continue growing, organizations must clearly understand how their efforts will result in a quantifiable impact on the customer’s perception of the company. And they must do so before it’s too late. Want evidence? Look at Southwest Airlines as a clear example of what can happen when you ignore problems until it’s too late.
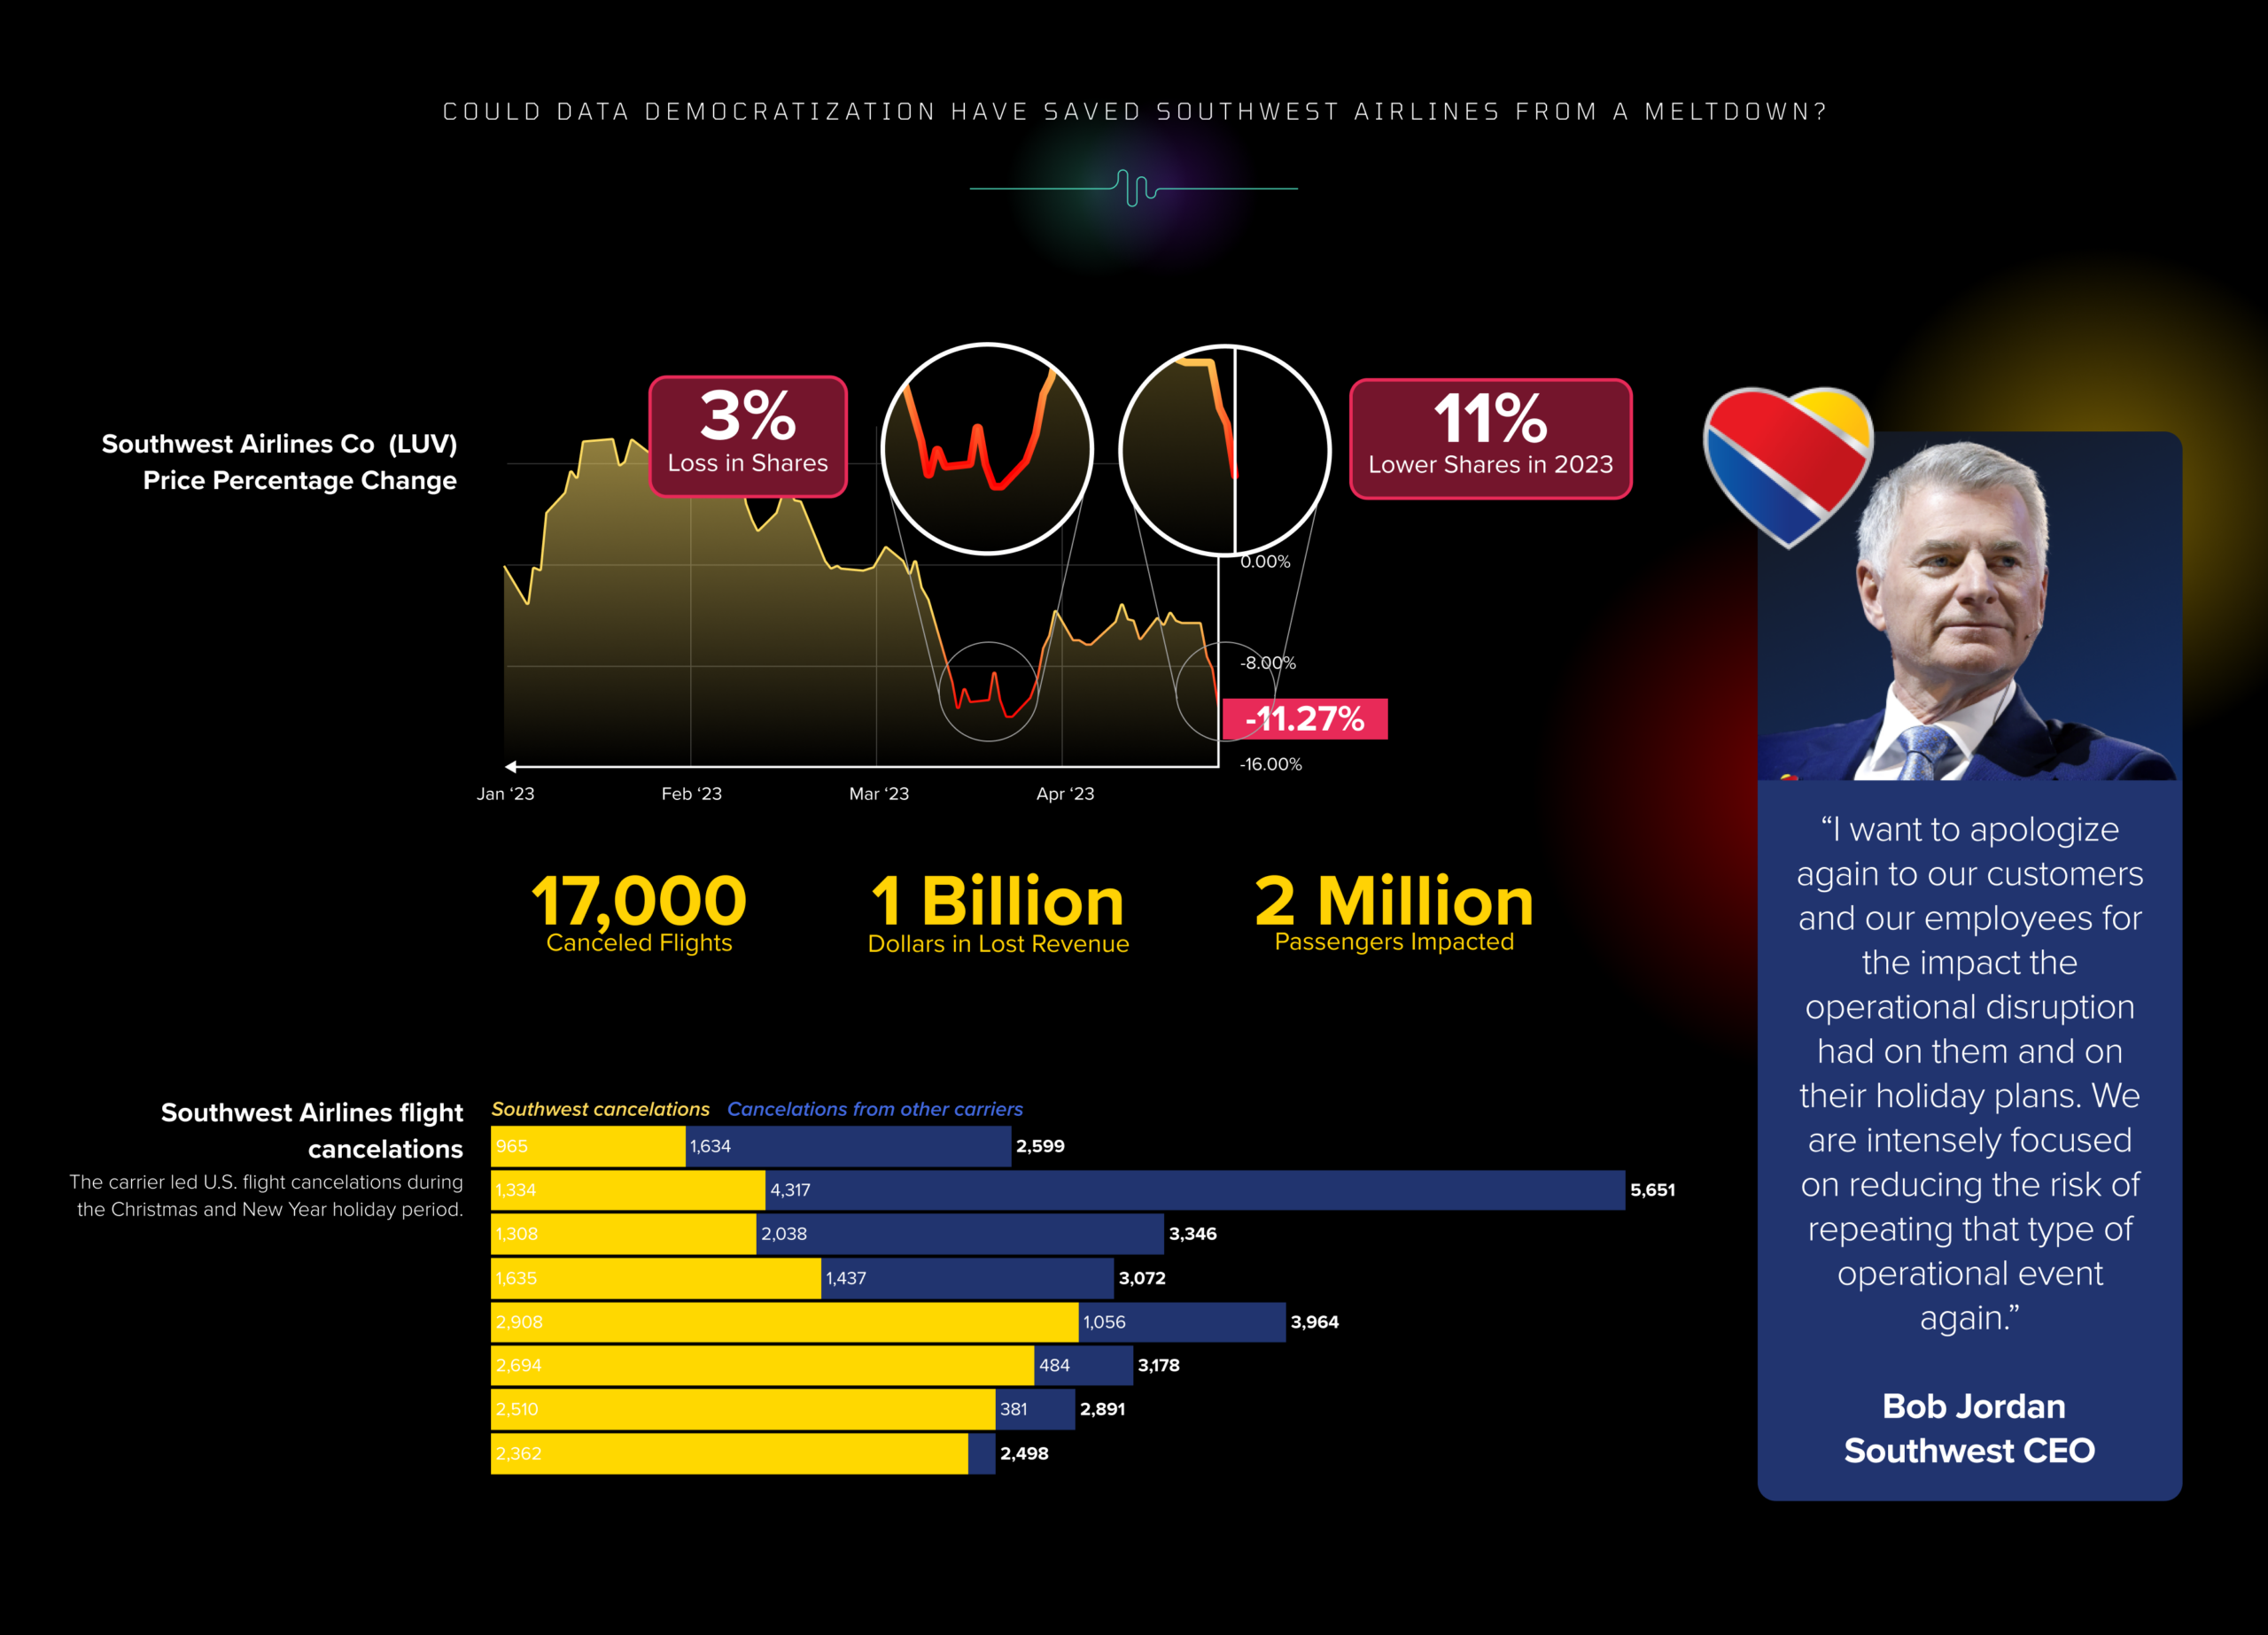
In December 2022, Southwest Airlines was blasted across headlines all over the news after canceling 17,000 flights and disrupting travel plans for more than 2 million customers. To put emotion to those eye-popping data points, here’s what happened due to Southwest Airlines’ extreme mishandling of their business. People missed funerals. Cancer patients missed treatments. Those dire human catastrophes and the enormous price tag of $1 billion in fourth-quarter earnings due to failed flight plans prompted shareholders to file a lawsuit and the Department of Transportation to investigate what went wrong.
The airline tried to hide behind the guise of bad weather, but it was clear that more was at play here. Upon digging deeper, Southwest Airlines’ union said that the problems resulted from a failure to update crew scheduling systems and software. As mentioned above, teams clearly need to understand how IT plays a role in revenue growth. The lack of operational resilience led to billions of lost dollars, a 3% decline in the company’s stock, and worse — lost loyalty from a long-time customer base after their holiday plans, family memories, and health were impacted due to corporate failure. This fiasco might not have happened if Southwest Airlines kept up with a notoriously aging system. And had the organization listened to the employee’s feedback, gathered internal qualitative data, and democratized it, these red flags could have been raised earlier, allowing the organization to get ahead of the issues.
Many people we talk to every day grasp the importance of democratizing data at a 40,000-foot view, but few understand what the concept really means. For the sake of this post and any future conversations we may have with you, here’s how we define data democratization:
Data democratization is the readily available data reporting as it relates to the interpretation and understanding of an organization’s constellation of North Star Metrics.
It’s not necessarily enough to have the data and capture it. Organizations must have the data and transform it into reports that are readily digestible, understandable and filled with obvious insights. But data alone isn’t enough. Data democratization should also come with a plan of action and standard operating procedure that let teams know which reports are looking at with which frequency to ensure they’re looking at the symptoms correctly and evaluating root causes when something goes awry. While we know that not every person in every organization is knowledgeable in data collection and visualization, they still need to understand the consequences of their action or inaction and what that does against leadership’s goals.
It’s this zooming in that will start to bring clarity to what’s really happening below the surface of your organization. When an organization stagnates, the risk isn’t that growth will stay level; growth will go downward instead. Stagnation can cause an organization to erode relevancy by not keeping up with market trends and demands. Competition grows by overtaking that role of relevancy in the consumer’s life, and soon, organizations can go the way of Blockbuster when Netflix entered the market years ago. Beyond the downward trajectory, organizations risk losing top talent. That loss of team members can lead to inefficiencies in teams organization-wide. It’s a downward spiral that can subtly, yet rapidly, move a team in the wrong direction.
There’s no AI to figure this beast out. To avoid falling victim to stagnant growth, teams must have access to this information through democratized data sets that are easy to interpret so that teams can see the impact of their actions or inaction. Through this understanding, teams are equipped to know how to tap into revenue acceleration opportunities. It requires human thought to tame the noise and democratize the right data to break teams out of siloed, competitive thinking, so you can retain your top talent, achieve Product-Market Fit and grow — even in unsteady times.
Misinterpretation as the Result of a Lack of Data Democratization is the Number One Problem Facing Businesses Today
There are distinct challenges when navigating today’s complex commerce ecosystem. But getting teams to admit to those challenges and have a humble attitude about where and how to improve things is the first step toward growth and transformation — and it’s not an easy step. Teams struggle to take this first step by staying surface-level with the data they use to make key business decisions. Without validation across multiple teams and fail-safe measures, organizations will struggle to know with certainty that the data being democratized is telling an accurate story.
To paint a picture of what this sometimes looks like in action, consider the common hyper-focus on quantitative or automated data sets, such as conversion or retention data. While there certainly is value in those data sets, teams struggle to pinpoint recent and relevant insights that shed light on what’s happening internally and externally in the market, and use those insights to get to the root cause of what’s happening in the organization. For example, quantitative data can show a decline in user retention, but qualitative data uncovers why that decline occurs. It may be lower customer sentiment data about the brand that has caused consumers to go to the competition, but without mining qualitative data, organizations would not have that knowledge or understanding.
Successful teams exchange competition for cooperation and cannibalization for collaboration.
Teams today have been trained to stay in their lane. They’re given a hyper-specific set of metrics to look at to know whether they’re performing at their jobs, and often, their pay structure is reflected in those metrics. Yet successful teams know the immense power that comes from drawing insights from other departments and leveraging those to drive decisions that influence the greater organizational goals rather than departmental goals alone. Similarly, teams must collaborate on the data provided rather than cannibalize each other’s efforts by keeping it in silos.
The Domino Effects of Using Data Democratization for More Intelligent Decision Making
There’s a common pattern we see in organizations today. Senior management sometimes looks for quick ways to make brash decisions without looking downstream to understand the ramifications of those decisions. As a result, these decision-makers will often get stuck in the weeds, only looking at what’s immediately related to them or in front of them. For example, if a director decides who to fire based solely on which employees routinely have their cameras off, causing them to assume which employees are vested, they could be causing higher attrition for their draconian efforts. One of those team members who might appear disengaged simply because they have their camera off for a meeting could actually be a top salesperson.
Data validation and custom metrics can help teams evaluate the health of the business’s ecosystem. The reports that can flood out from there can show how channels and various nuances within each channel are performing. In accessing this data, teams can:
- Reduce the risk of turning off a revenue spigot leveraged by another department by getting teams out of their siloed thinking and decision making
- Determine the root cause of what’s working and what isn’t organization-wide
- Build organizational awareness around all of the factors impacting the organization’s key metrics
Because of this antiquated approach, teams are starting to see the dire impact it can have on the organization. There’s a common outcry by senior management when sales team members resign that can lead to statements such as, “Those team members should’ve felt lucky they had a job.” However, attrition among sales teams isn’t something to denounce. It’s something to explore to ensure the organization isn’t starting to travel along the path of obsolescence.
Democratizing the data across all departments helps pinpoint opportunities before a catastrophic domino effect occurs.
To paint a picture of the catastrophic domino effect plaguing companies today, let’s break out four common areas where we see the critical need for more data democratization as fuel for intelligent business decision-making.
1. Sales Team Performance
Perhaps the most scrutinized team in the organization is the sales team. However, this department’s success is rooted in peripheral factors that are often out of their control. Those factors often go unnoticed and unaddressed without a process to democratize the data the sales teams receive from the customers directly. As a result, a significant domino effect unfurls, impacting the performance across all departments and, eventually, the organization as a whole.
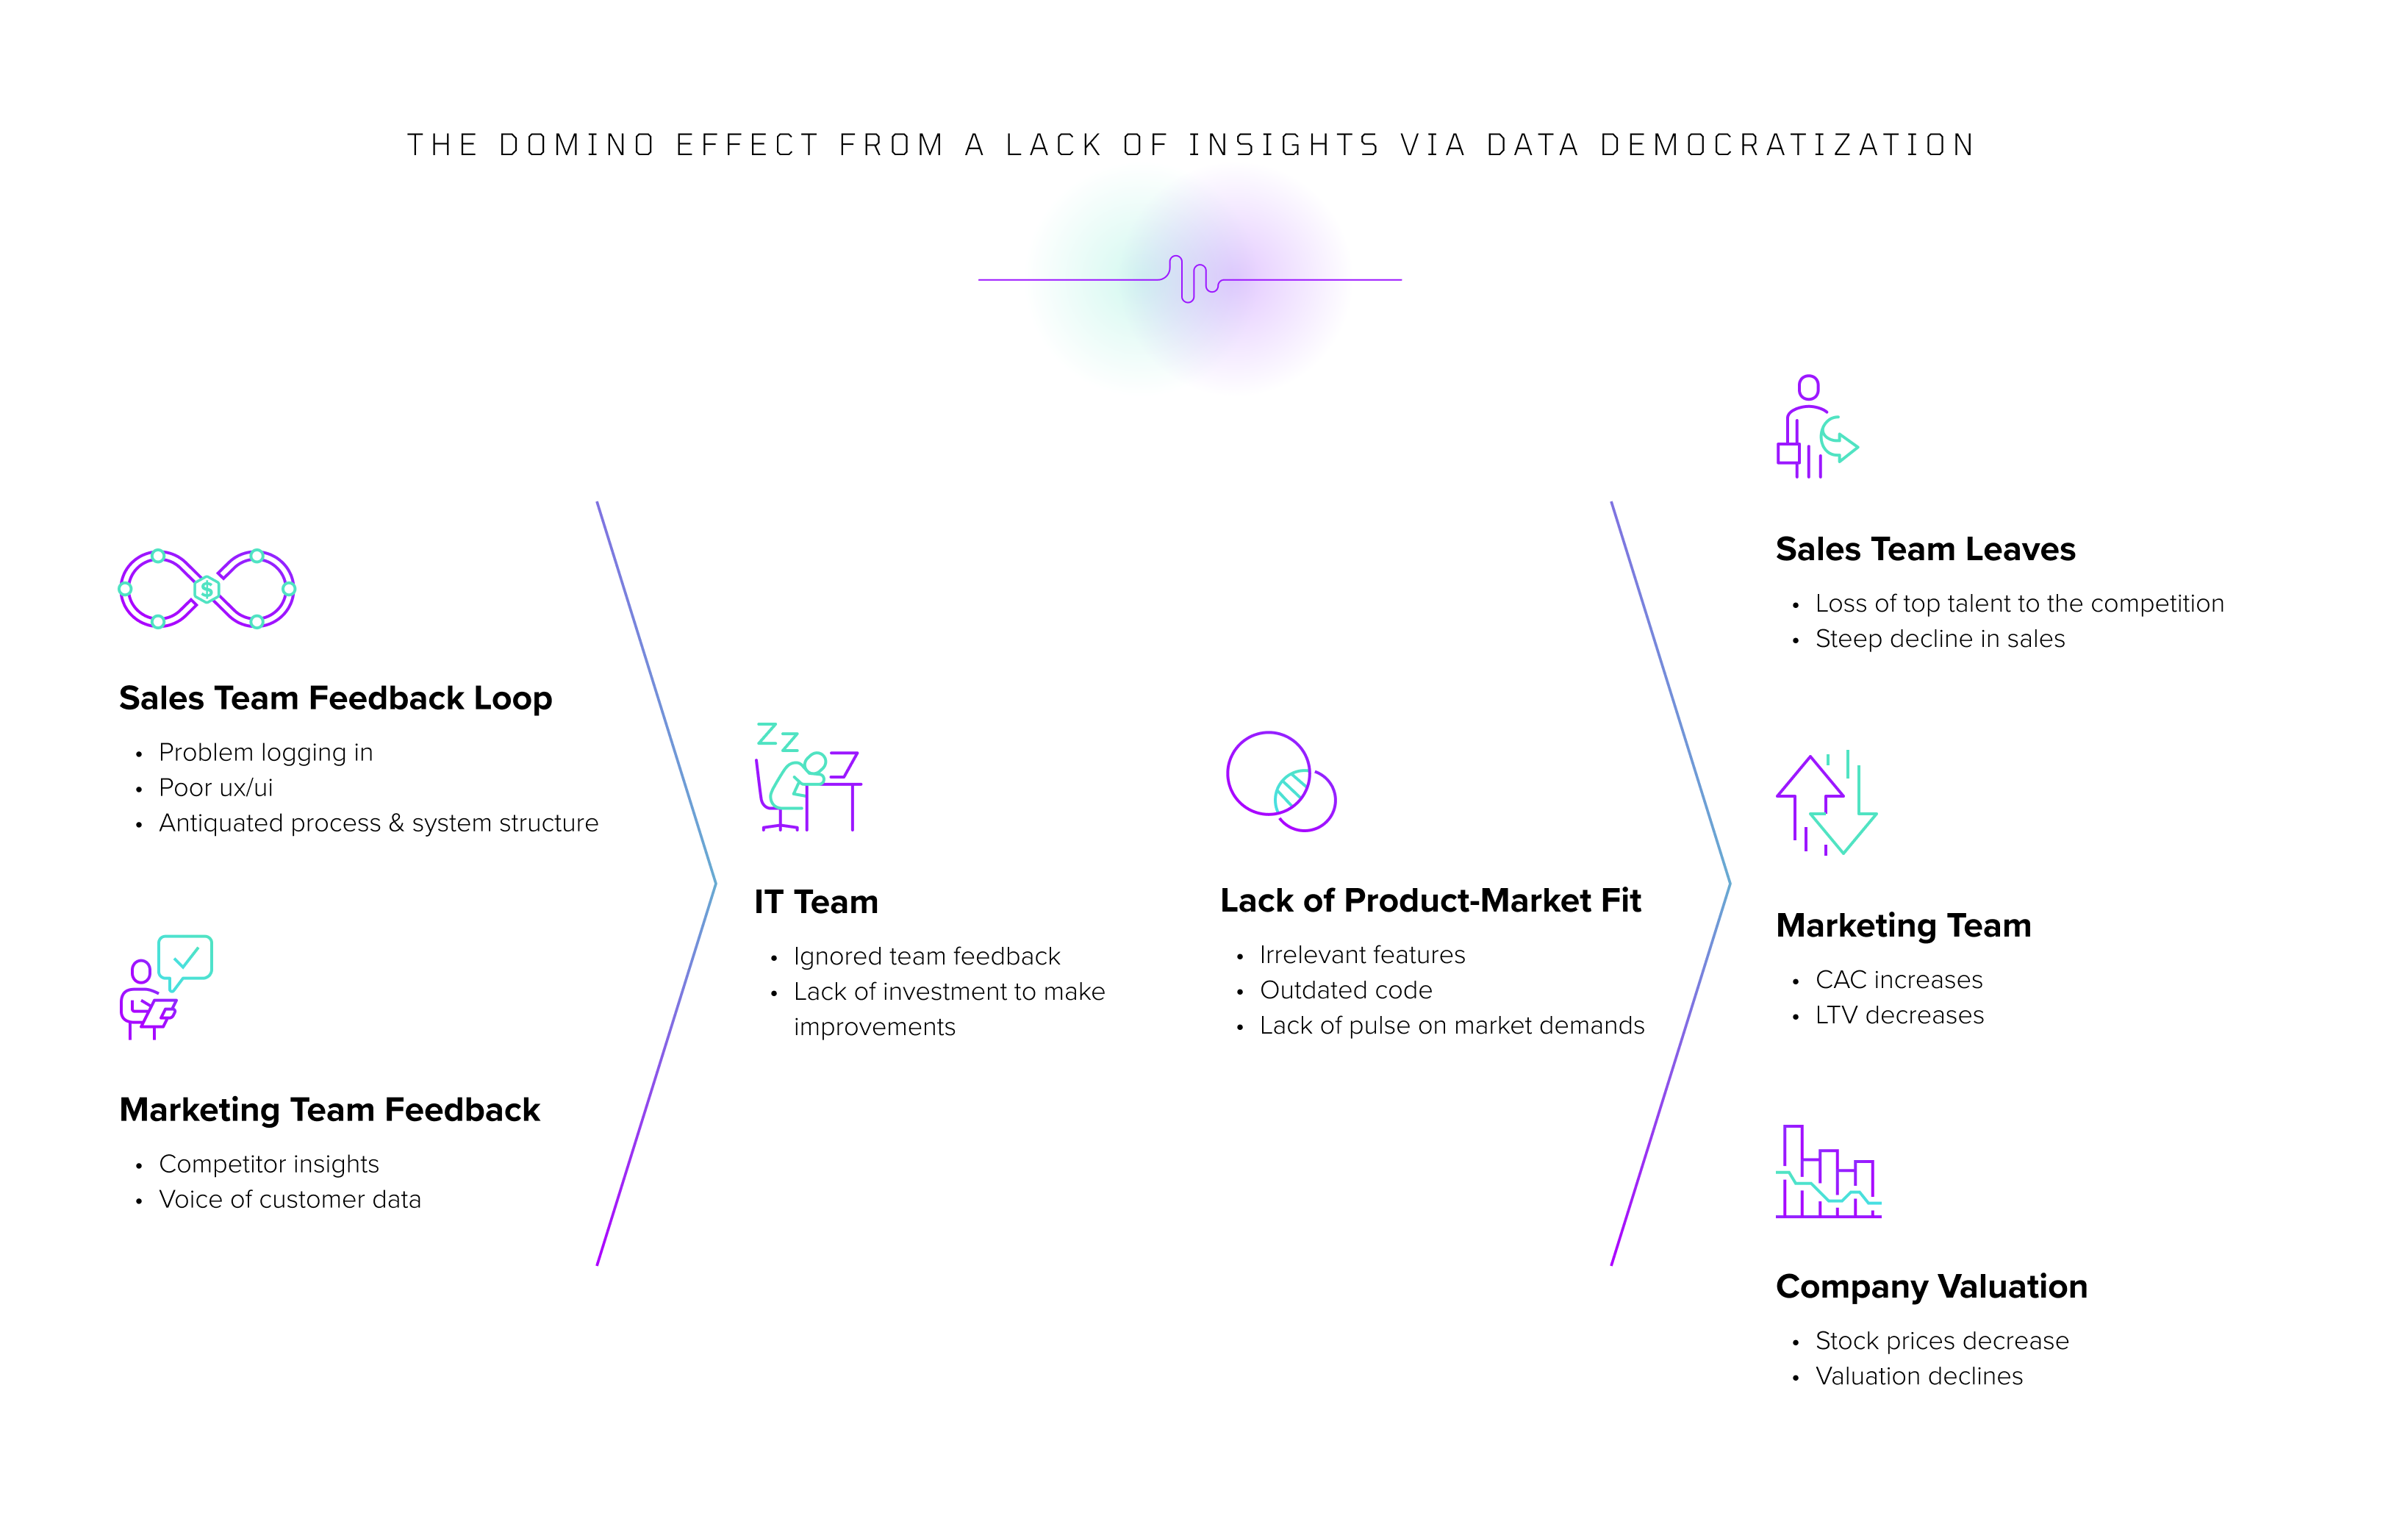
In the example above, you can see how challenges arise across the organization when the sales department receives data, but that data doesn’t get disseminated properly to other departments. Based on a simple audit of the feedback sales teams received in the field, it’s clear in this example that there were problems logging into the platform they were trying to sell and that the user interface (UI) was too confusing. That type of feedback is a data gold mine for organizations if it’s used properly. However, problems often arise because that feedback sits unread in inboxes causing the team to feel unheard, undervalued and unsupported in earning the commissions for the lost sales teams. Worse yet is when senior management ignores the feedback and cuts budgets that could have helped develop a product that consumers want.
2. Marketing Team Performance
Marketers are often judged and paid according to their own set of metrics. One of those metrics commonly tracked to judge the marketing team’s performance is the marketing qualified lead (MQL). The challenge with MQLs is that marketers could be unfairly judged if they’re not evaluating their own efficiencies in converting those MQLs, or who they’re reaching.
Having a low-cost MQL as the marketing team’s North Star metric means the team is incentivized to go after as big of an audience as possible simply to bring in new leads and reduce their costs. As you peel back the layers, it’s clear that this approach shouldn’t just be treated as a numbers game, or team members may start acting more nefarious, such as offering things they shouldn’t offer for the sole reason of bringing in more leads. Few organizations go the extra mile to evaluate how many leads convert to enrollments or paid customers. By not evaluating the entire funnel, revenue opportunities for growth and market alignment are missed. Instead, they focus on a singular task to check a performance metric box.
3. Product-Market Fit
The same also holds with unpacking the root causes of Product-Market Fit, which we’ve discussed at length in our previous post on the subject. How do you decide where to invest in development? And how do you communicate these challenges, concerns and needs before your best people leave? Without having insights-driven answers to these questions, your teams will struggle with clear guidelines and directives, which could harm morale.
4. Team Morale
There’s a giant elephant in this proverbial room as we talk about performance metrics — how will companies decide which team members to keep and who is at risk of being laid off? Given the current macroeconomic backdrop, this question holds extra weight as more organizations see the potential for a bleed coming. Employees are feeling this weight too, which has caused a tremendous shift in employee morale. This scenario begs a few questions.
- How do you communicate to your team that they’ll be safe to preserve employee morale?
- How do you know who to lay off? Or who not to lay off?
- What will the impact of these layoffs be two years from now?
Understanding which teams drive success, what each team size needs to be to continue that success, and which teams are tenable to the operations is crucial for making these core business decisions. When teams see upper management leaning into this data and when they’re given the metrics that will make sense in these critical job decisions, morale improves. Without this level of transparency, teams risk losing top talent quickly because those people are the most hireable. And, as those managers leave, others in the company will often follow suit. Analyzing employee attrition can help determine which people make the most sense to lay off or keep from a domino-effect perspective based on historical data within the organization.
Three Requirements of Proper Data Democratization to Take a More Predictive Stance
The above-mentioned deep-rooted problems, and many others, start from a place of misalignment. Easing the misalignment plaguing organizations today requires forecasting and modeling results based on various inputs — not just a handful. We’ve previously shared four machine learning models we believe every organization should have in production to achieve this level of transparency and democratization:
- Lead/Opportunity/Conversions Model
- Attrition/Customer Retention Model
- Lifetime Value Model
- Employee Retention Model
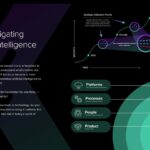
These four models are critical for forecasting and taking a more predictive stance because their outputs bring more clarity to the things that matter from all vantage points and at varying degrees of focus. Think about what the world looks like through varying degrees of magnification as an admittedly oversimplified example. What you can see through the lenses of binoculars is vastly different than what you can see through the lens of a telescope perched on a hilltop with no ambient lighting. Still, there’s use for these and other magnification tools to bring critical details into focus.
Data democratization is one specific lens that allows teams to understand what teams should be doing and when to prevent slipping down the S Curve of Growth, becoming irrelevant, and ultimately disappearing completely. That is the gravity of the situation at play in today’s world.
With that in mind, the root cause of a lack of data democratization is something else. It could be Product-Market Fit. It could be a core problem within the organization’s people, processes and platforms. Or, it could be a misalignment with their why. Identifying those root causes requires that you have the right data in front of you can make the insights readily accessible and digestible. To that end, there are three requirements to bring the right elements into focus — having quality data hygiene to ensure teams are looking at the right data, improved communications between teams through the same data and the same vernacular, and analyzing human behavior to predict future purchase behaviors as spontaneous trends emerge in our ever-changing world.
Requirement #1: Looking at the Right Data
People often look to data and insights for a silver bullet to get the company back on the right trajectory. What’s less looked at but far more powerful in long-term and sustainable success is the root cause of what’s impacting core business promise and model. Take a puzzle company as a prime example. If the company started its journey creating beautiful landscape puzzles but then leaped into a new line of puzzles focused on comic book characters, it’d risk losing a huge portion of its audience while investing heavily in licensing those images. While the CEO might have thought that releasing more designs would be the silver bullet for growing sales, the root cause of a lack of growth was likely something separate. By looking at the wrong data, the CEO cost the organization a lot of money they will never see return. This often happens when decision-makers take data at face value rather than understanding the root cause, testing iteratively to see the impact of adjustments on their revenue, and ultimately optimizing budgets to improve long-term ROI on the changes made.
It’s great when a medication can treat a symptom but bad when it can kill your liver. The same holds in organizations.
Cutting a tool that saves a few dollars but helps to optimize budgets or automate tasks costs more in the long run. Managing communications around the right data can help teams make core business decisions that simultaneously build revenues and ROI. This requires cross-departmental communication around the right data points to get right.
Failing to look outside departmental viewpoints to see the big picture of what’s happening across the market and industry causes a windfall of problems. For example, consider a company with the most profitable month in its history. Immediately marketing would dive into button colors getting updated or new subject lines they tested. Sales teams would look at shifts in how conversations unfolded. Legal would investigate law changes. Suddenly, everyone in the organization chases their tails around what happened in their department so that they could get credit when it had nothing to do with them.
This example begs the question — where would your teams attempt to analyze the impact of your biggest sales month on record? Do you have the infrastructure to get a real-time understanding of what’s going on? Where would you start analyzing this type of growth in your organization?
What might surprise you is that when we’ve done this analysis for clients, we often find that neither market, sales, legal, or anyone else had a singular impact on the organization’s steep uptick in growth (or steep downfall of sales). It’s often a macroeconomic trend that impacted success — something that can only be uncovered as the root cause by having the right systems and data in place. Reaching this deeper analysis of the right data requires that teams break away from departmental viewpoints alone and get to the root cause of what’s happening to take a more predictive stance when finding growth areas.
Looking for these trends should be baked into every organization’s operations. Ensuring everyone knows these trends allows every team to shift their strategy accordingly. Media knows where to target. Creative teams know what to write about. Finance can prepare for upticks in budgets or downfalls of ROI. It all works in tandem, but teams often look exclusively at their own data to make decisions rather than asking bigger questions, such as:
- Where did this stride come from?
- Was it led by a competitor’s downfall?
- Was it caused by a change in public perception or sentiment?
This is only one example of where a company can spend weeks trying to hone in on what happened by attributing the win to one department. Legal can spend weeks running reports. Marketing can spend weeks looking at all of the split testings they did. Sales can spend weeks sifting through customer conversations. And then, after those findings, everyone will present their findings and look for the impact on CAC. All of that time would be spent chasing the wrong data because it was a seasonal trend that didn’t correlate to any one action by one department. Instead, if the team had the right data, they would’ve been ahead of the curve and prepared to maximize the next seasonal trend.
The data your team looks at can be the difference between surging ahead of the competition and falling behind.
Although the example above referred to a high revenue month, it’s important to distinguish that revenues aren’t the only story when analyzing wins within your organization. It’s only a single data point in a constellation of North Star Metrics. Revenue alone doesn’t speak to profitability, retention, market relevancy or other critical levers that push and pull on the independent variables.
Alignment comes from getting everyone on the same page so that teams know what to look for and can pinpoint opportunities in market trends. Without understanding the root causes of growth and stagnation, your organization will miss a market trend and incorrectly expect a stride to continue. In doing so, you will not be prepared to capitalize on the next shift in public sentiment or in the market.
Consider two top companies in the weight loss industry, Weight Watchers and Nutrisystem, for an example of the importance of watching for these trends.
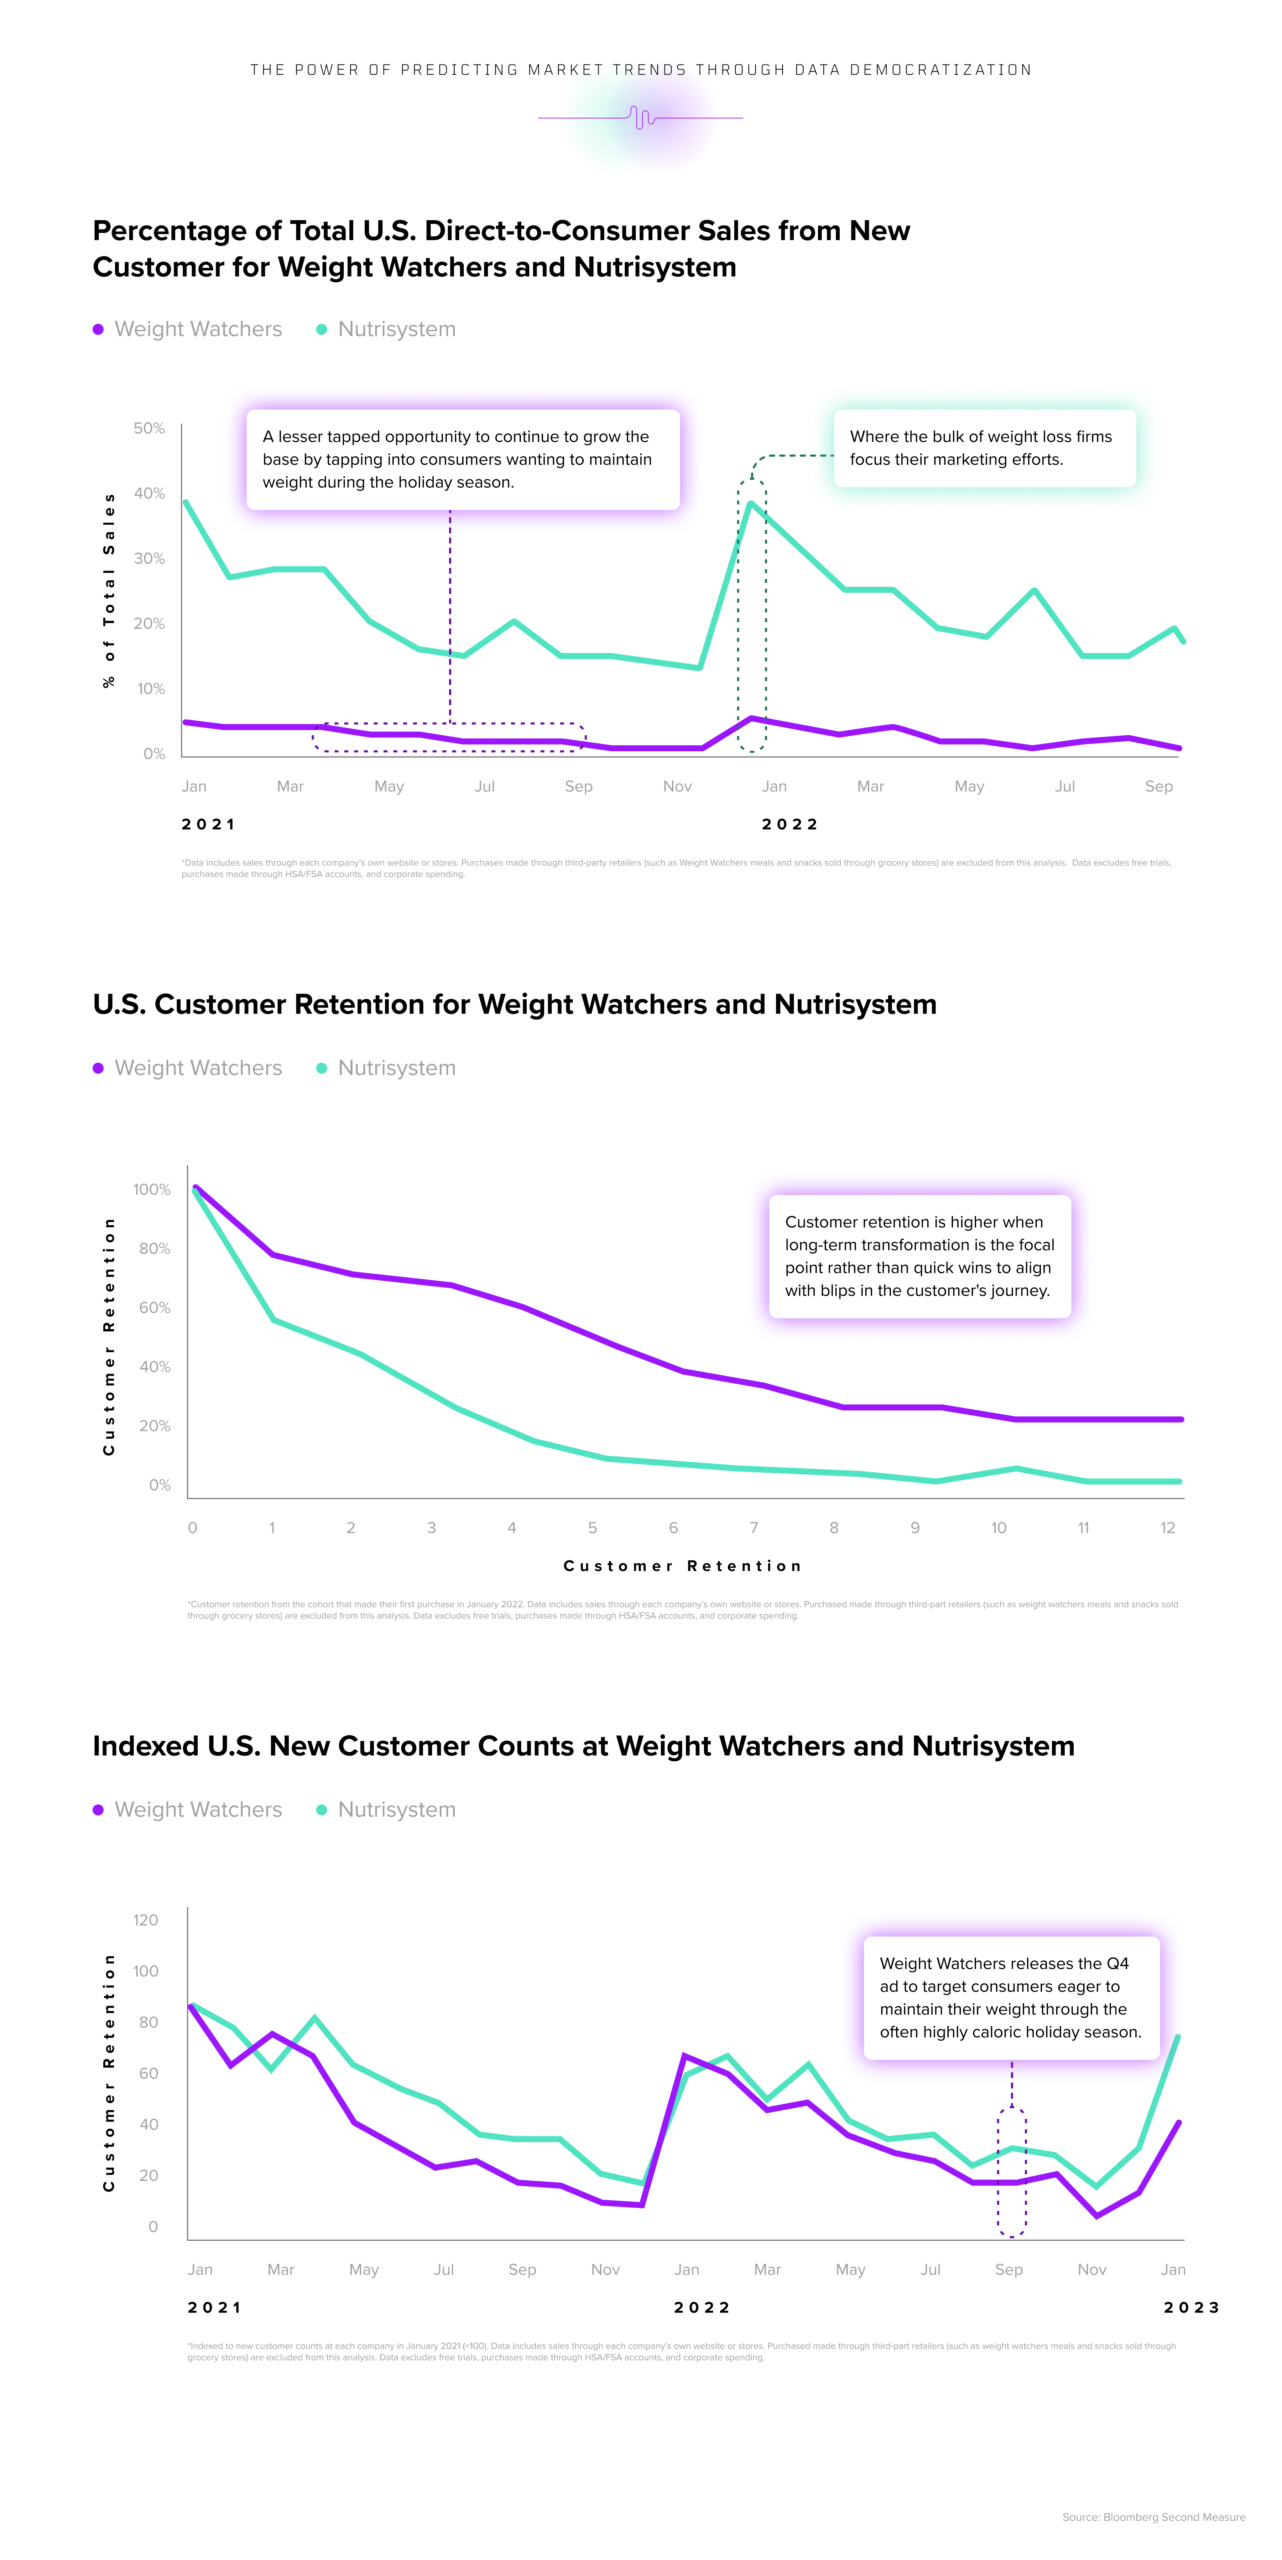
In the weight loss industry, there’s a funny trend that’s predictable year in and year out. It’s the January burst where more consumers get dedicated to living out a New Year, New You style resolution. They buy supplements, weight loss programs, and healthy foods to support a lifestyle they promise to themselves. Each year, both Weight Watchers and Nutrisystem see a spike in new customer acquisitions. This spike maintains for several months as consumers get to work on their beach bodies in time for the summer season.
However, as you look at the difference between these two companies, you can see that Weight Watchers has tapped into another window of opportunity often missed in this industry. That’s the maintenance window where a certain segment of consumers simply works to maintain their weight through the holiday season. By looking at a long-term analysis of the market, many organizations in this niche typically predict that the first quarter of the year is the only time when joining the program will see a burst. However, at the backend of the year, there’s still demand if it’s articulated correctly.
Weight Watchers hit this messaging out of the park in a Fall advertisement that leveraged several market trends to capture their audience’s attention. Check out the 15-second ad here:
This ad proved to be successful for several reasons. The imagery aligned with the current lifestyle backdrop for their target audience — watching sports in the sports bar with friends. The campaign wasn’t about losing weight as much as maintaining, as evidenced by the line, “progress over perfection.” The music trended on Tik Tok then, letting the target audience know that the program was for them.
On the surface, it might seem that the marketing department could take the win for that blip upward in sales simply because of this ad. However, upon digging deeper, it’s clear that for it to have succeeded, the entire organization had to have a pulse on the market trends. This ad alone wasn’t what caused the consumers to start looking for Weight Watchers and choose them over the competition. It was a repeated trend year-over-year that Weight Watchers saw and capitalized on that, allowing them to answer critical questions that would drive market alignment based on past trends, such as:
- Why does this trend happen?
- What are users doing to drive this trend?
- Are there similar trends within this cohort that we’re not going after?
- Is our marketing only speaking to one of these trends?
- Is our product only articulating one benefit or angle to the why of the customer without paying attention to another why that our customer needs?
Weight Watchers did a good job of focusing on multiple whys of their customer in this particular season. It was about balance during the fun of football season. It was about progress, not perfection. It was about feeling their best while living their best life.
Big revenues aren’t the whole story, as we’ve mentioned before. Profit margins, CAC and LTV all support the growth of a company. While leaders know this, bankruptcies still happen because of a lack of insight into the innovations occurring within the market. Banks are closing. Companies are closing. People know they should be tracking these metrics, but a lot can and does go wrong. How the organization tracks them, how the team analyzes them, or even the frequency at which the data is being analyzed leads to these problems. Being unaware of innovations and trends means you’re missing variable change.
Product-Market Fit is not static. It requires that organizations evolve alongside consumer demand changes and competitor innovations.
Major corporations get this wrong all the time. Think back to how the Microsoft CEO laughed at the idea of the iPhone back in 2007, assuming the consumer wanted a keyboard over a touchscreen. Instead, Apple noticed a way for the smartphone to fit into someone’s lifestyle beyond text and email. Now, consumers feel empowered by having a phone and the Internet in the palm of their hand. Companies can’t fall into the trap of staying status quo because they’re looking at the wrong data. By wrongly assuming that everyone has the same pocketbook or incorrectly evaluating utility over moral value, teams miss the mark. A person may purchase one product over another for many emotional reasons, especially as consumer demand changes.
The problem isn’t that organizations don’t have enough data to keep track of these changes and innovations. It’s that they’re not monitoring the right data to spot when the changes and innovations occur and predict future consumer behaviors. Organizations are rushing to collect every data point possible and every behavior that users engage in. Yet, despite collecting that data, they’re not acting on those insights, or conversely, they’re doing too many things at once. Suddenly, teams aren’t sure how to prioritize their efforts. Instead of being proactive, they tend to act at the last minute or become reactive to market shifts.
Minimizing essential data throughout the customer’s journey can cause organizations to focus on the wrong thing. Acting on too many data points can cause the pendulum to swing in the opposite direction, wreaking havoc internally and externally with a host of changes that breeds confusion, overwhelm, and ultimately, a lack of Product-Market Fit, where the product itself no longer aligns with what consumers want. The root cause of this misalignment could also be having the wrong people at the helm managing the data, the wrong processes to extract insights, or the wrong platforms to bring in the needed information. Going deeper and democratizing data across all areas of the organization can help teams spot anomalies and use those to dig below the surface to drive growth.
There’s no danger in getting granular. There’s danger in placing too much weight on the wrong data.
When looking at a data set, it’s crucial to analyze the insights through the lens of the organization’s North Star Metric. When we look at data sets, we don’t look at them in terms of silos or specific departments. Instead, we start by unpacking the customer why across the board, drilling down to different segments, and working backward on what’s happening across multiple areas of the organization and the market. Getting buy-in around the right data sets is critical but can also be challenging. It requires frequent check-ins, organization-wide engagement, and validation throughout the data democratization.
Requirement #2: Removing Silo-Based Perspectives Which Cause an “Everyone For Themselves” Mentality Through Improved Communications
As more data becomes accessible and pumped into the organization, we’ve noticed a debilitating trend — teams hunkering down into their silo-based perspectives, causing mismatched expectations in the market and widening internal divides. These mismatched metrics and data points mean that teams don’t really know what’s happening or how their work influences the North Star Metric. Instead, each department runs a different race, ultimately eroding the employee experience to the point of teams fleeing the company to work for competitors.
Consider a pattern we’ve seen in the market when organizations try to reignite a stagnant product to paint a picture of what this could look like. For years, sales teams have sounded the alarm to IT departments and customer experience teams, stating the concerns they’re hearing on the front lines. However, after years of attempting to innovate, the team feels frustrated. The product hasn’t evolved in how it needs to be competitive, which means its insights haven’t been heard. Nothing is changing except this — layoffs are happening, and teams are getting put under more scrutiny. The sales department struggles to make sales and, ultimately, to get paid is forced to lie to customers or set incorrect expectations to make their commission check.
Meanwhile, in this same scenario, the marketing team looks at the 30-day churn and wonders why it continues to increase. They don’t have the insights from the sales team that there’s a lack of Product-Market Fit, so they turn their focus to split testing. They try changing button colors and split testing to see if it will solve all of their issues. It doesn’t.
Ultimately, teams start to leave. Leadership thinks it’s because the commission is higher than the competition. After all, that’s the logical trigger they hear in the exit interviews. However, the real problem is rooted in poor alignment between teams. Had the insights from the sales team not sat unread in an inbox somewhere, churn levels could’ve been reduced, and sales could’ve been made easier without having margin erosion from pushy discount offers or feeling the need to grasp for straws to get buyers to stay.
Silos can be eliminated when everyone looks at the same data sets through the lens of the same goals. This perspective expands beyond internal departments and teams too. Alignment across teams, vendors, and other third parties that influence the customer’s buying behavior can help teams stop spinning their wheels, resulting in both higher revenues and retention.
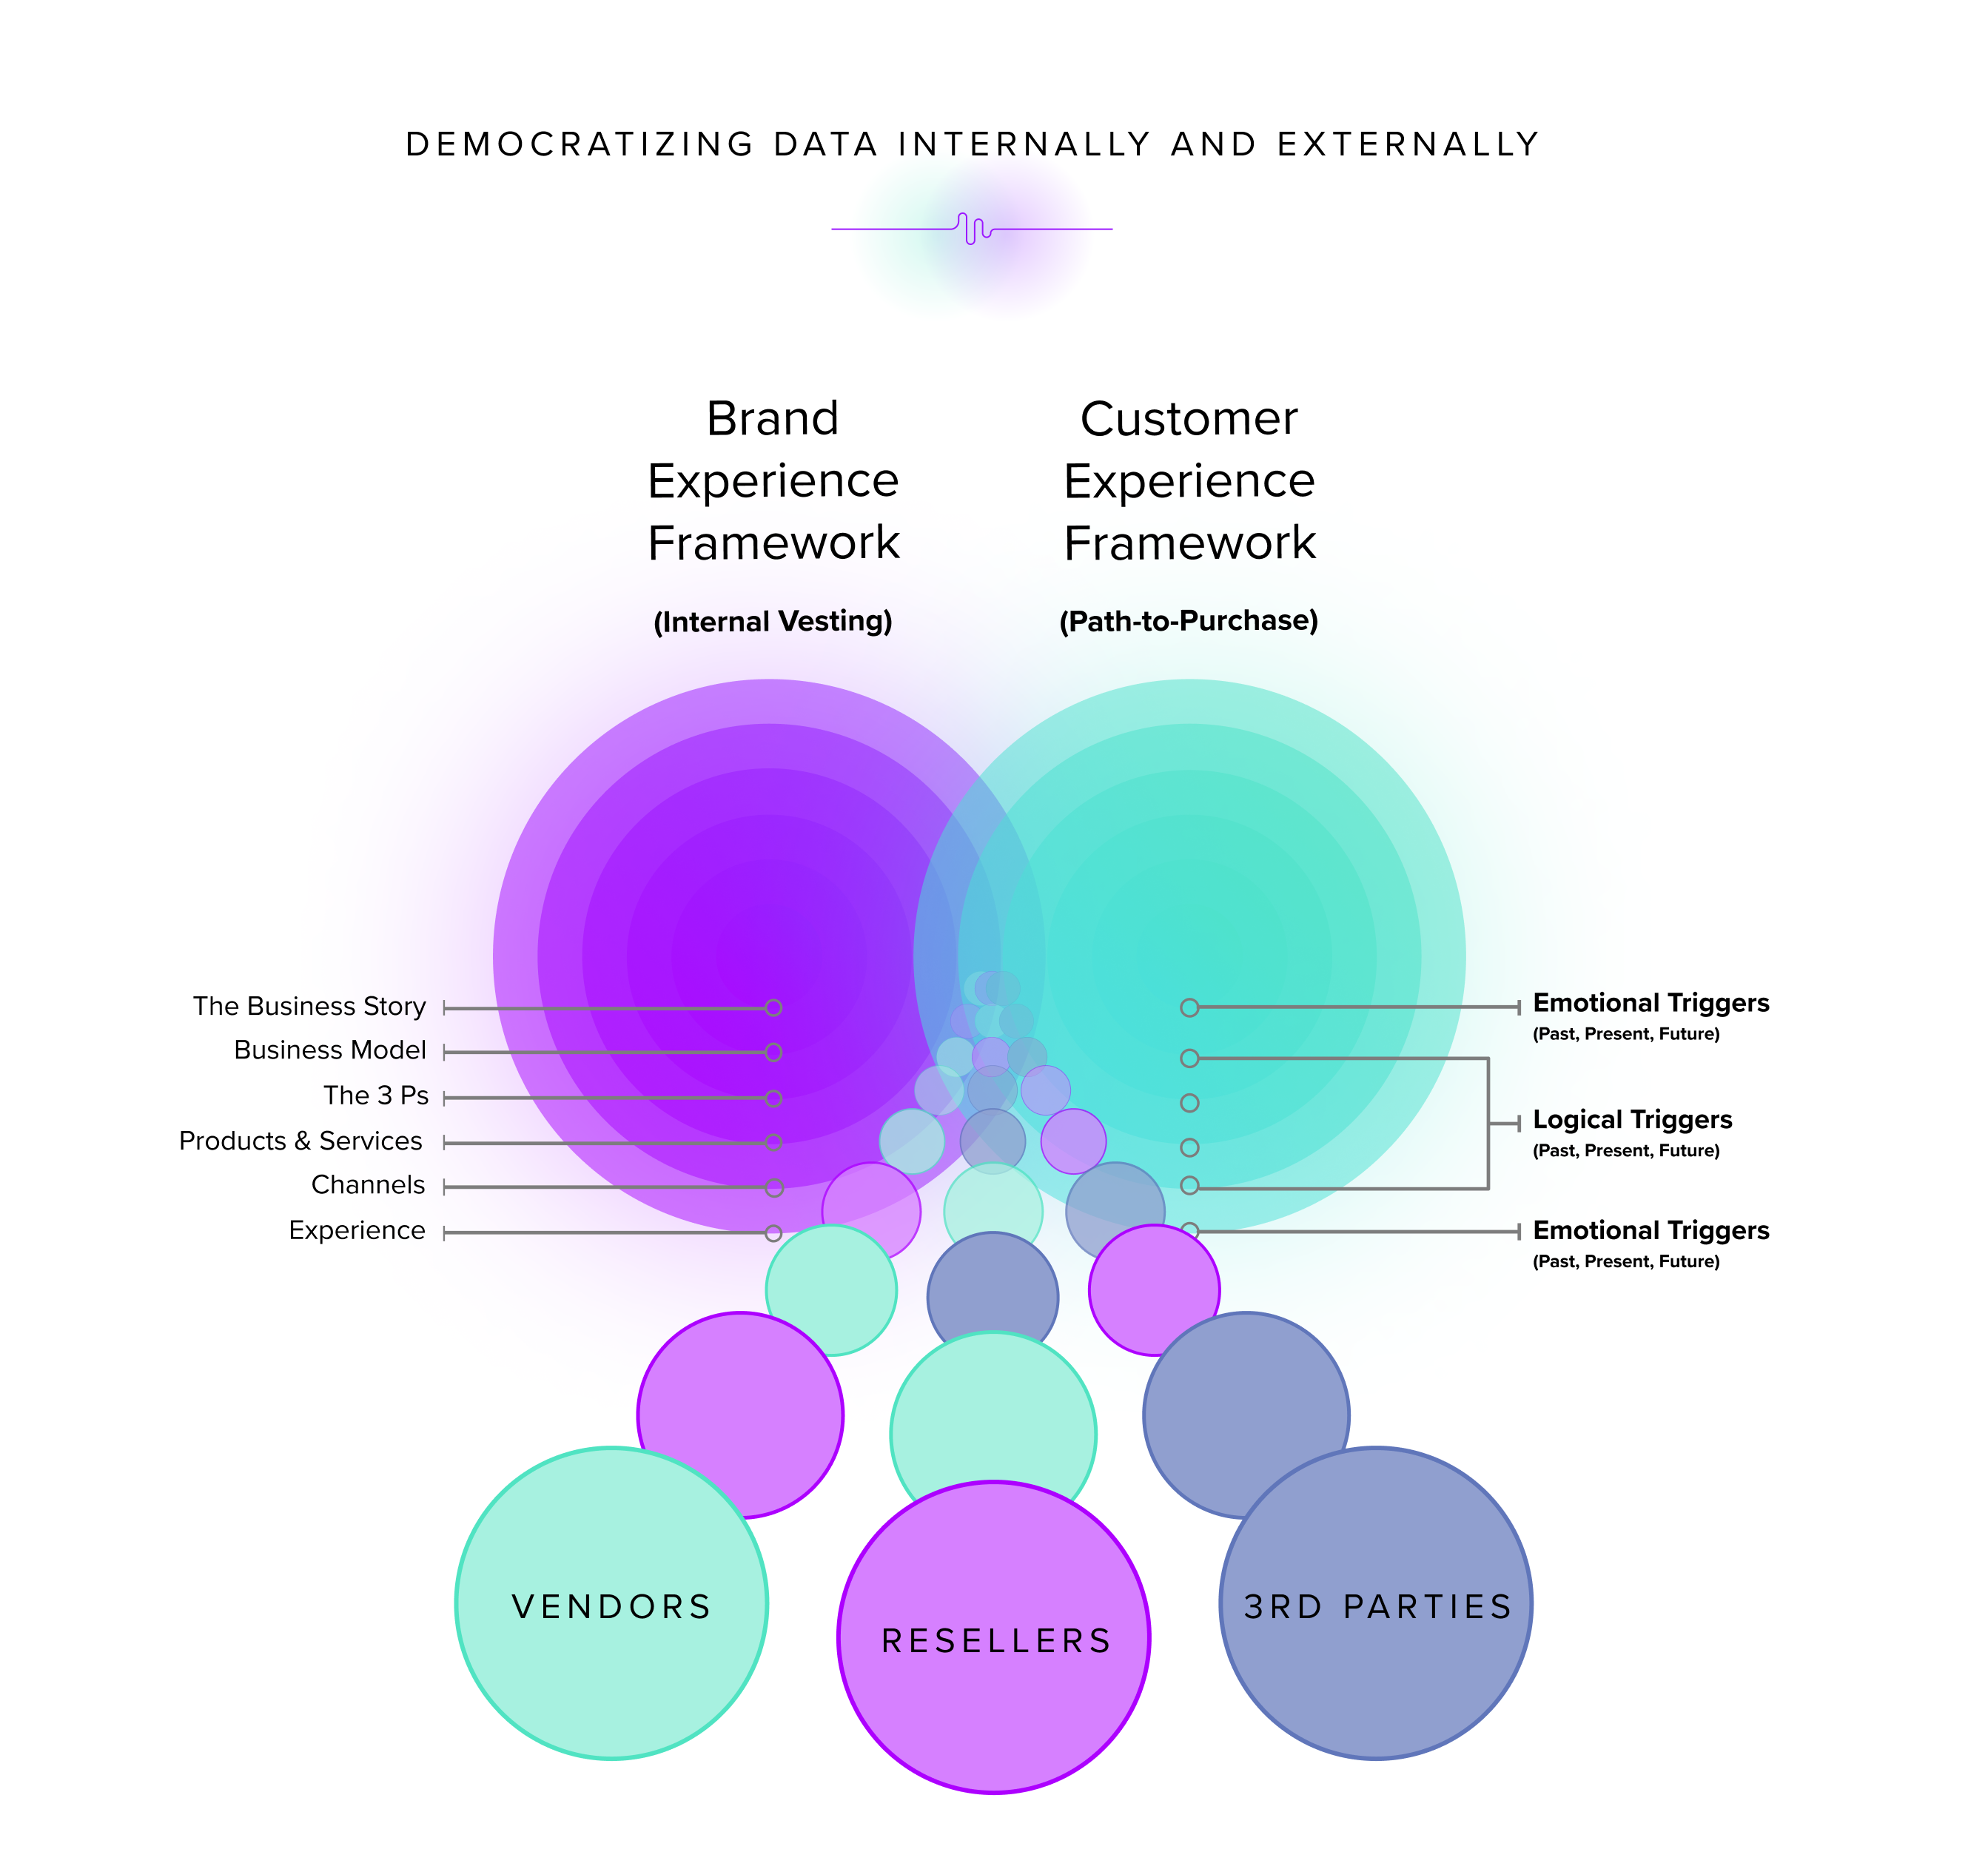
There are many layers in the brand experience and customer’s experience, as well as what’s happening in vendors, resellers, and other third parties. In other words, many races are being run in an organization, and because of that everyone seems to be chasing a different target. Sales chase a different target than marketing. Marketing chases a different target than the product. Vendors, resellers, and other third parties that interface with the company chase another target well outside the organization’s scope and why.
When managers incentivize teams to do A, they will do A, even if B is the better option. Misalignment across teams can cause cannibalization and missed opportunities because the teams are focused on the wrong things.
With a broader perspective that extends outside of their silo-based thinking, teams can better connect the dots of what’s actually happening in the market. Democratized data across all departments ultimately feeds in a wealth of knowledge that connects with the other journeys employees and consumers go through. There’s tremendous value in making those connections, yet some people hold it tightly to their chest because they’re scared of giving it away or democratizing it. With layoffs as a real threat in today’s economy, team members try to make themselves more employable by not sharing their data. In reality, those silo-based approaches end up causing more harm than good for the organization and for that employee who continues to work through a singular lens.
Ultimately, by operating with tunnel vision, teams hide the qualitative data they’ve gathered through their experience. When those team members leave, so does that data, costing the organization millions of dollars in spending and lost revenues because the insights are not readily accessible company-wide.
Requirement #3: Looking at Human Behavior as a Predictor for Future Purchasing Patterns
We often say a phrase to clients that causes a few eyebrows to raise — data is emotional.
Perhaps your eyebrows raised when you read that too. The reality is data is sentiment based. Analyzing data is emotional because it’s directly tied to consumer behaviors. Many overlook metrics as data points and forget that people are behind the facts and figures.
Data are people, not points.
Data gives us a sense of how consumers react to products daily. Data can also tell us how they feel about marketing messaging, sales techniques, and so much more. If consumers accept the messages they hear from companies and the products they purchase, great things can happen for both the business and the buyer. But, if consumers begin rejecting those messages and products, it becomes clear that the organization is failing to accurately meet the ever-changing demands of the consumer. Ultimately, every organization wants its products and services to be “sticky” or “stickier” than the competing alternative; and yet, without a flexible emotional-based data democratization plan in place, it’s easy to fall victim to operating within a tunnel of emotionless analytics.
But remember, no two consumers are the same. People are not linear beings that move in a machine-like fashion. To get to the heart of what’s happening in their mind as they navigate your buying journey, you must segment your audience and understand the various facets of the many consumers you attract.
There are many ways to segment those people into different groups to see what they care about. Yet segmentation often isn’t done well. By getting granular and splitting groups into different buckets, you can start to understand what’s happening more emotionally.
Consider, for example, that you run a subscription-based service. After approximately 90 days, your audience starts to lapse. They aren’t engaging with your service, and the cancellations start to roll in. By segmenting the consumers who lapsed from those active, you can understand why they lapsed, who they are, and what they chose to do instead. In understanding the segment of people less likely to continue with your service after 90 days, you can repair the leaky bucket and improve your efforts to lead a product-led growth strategy.
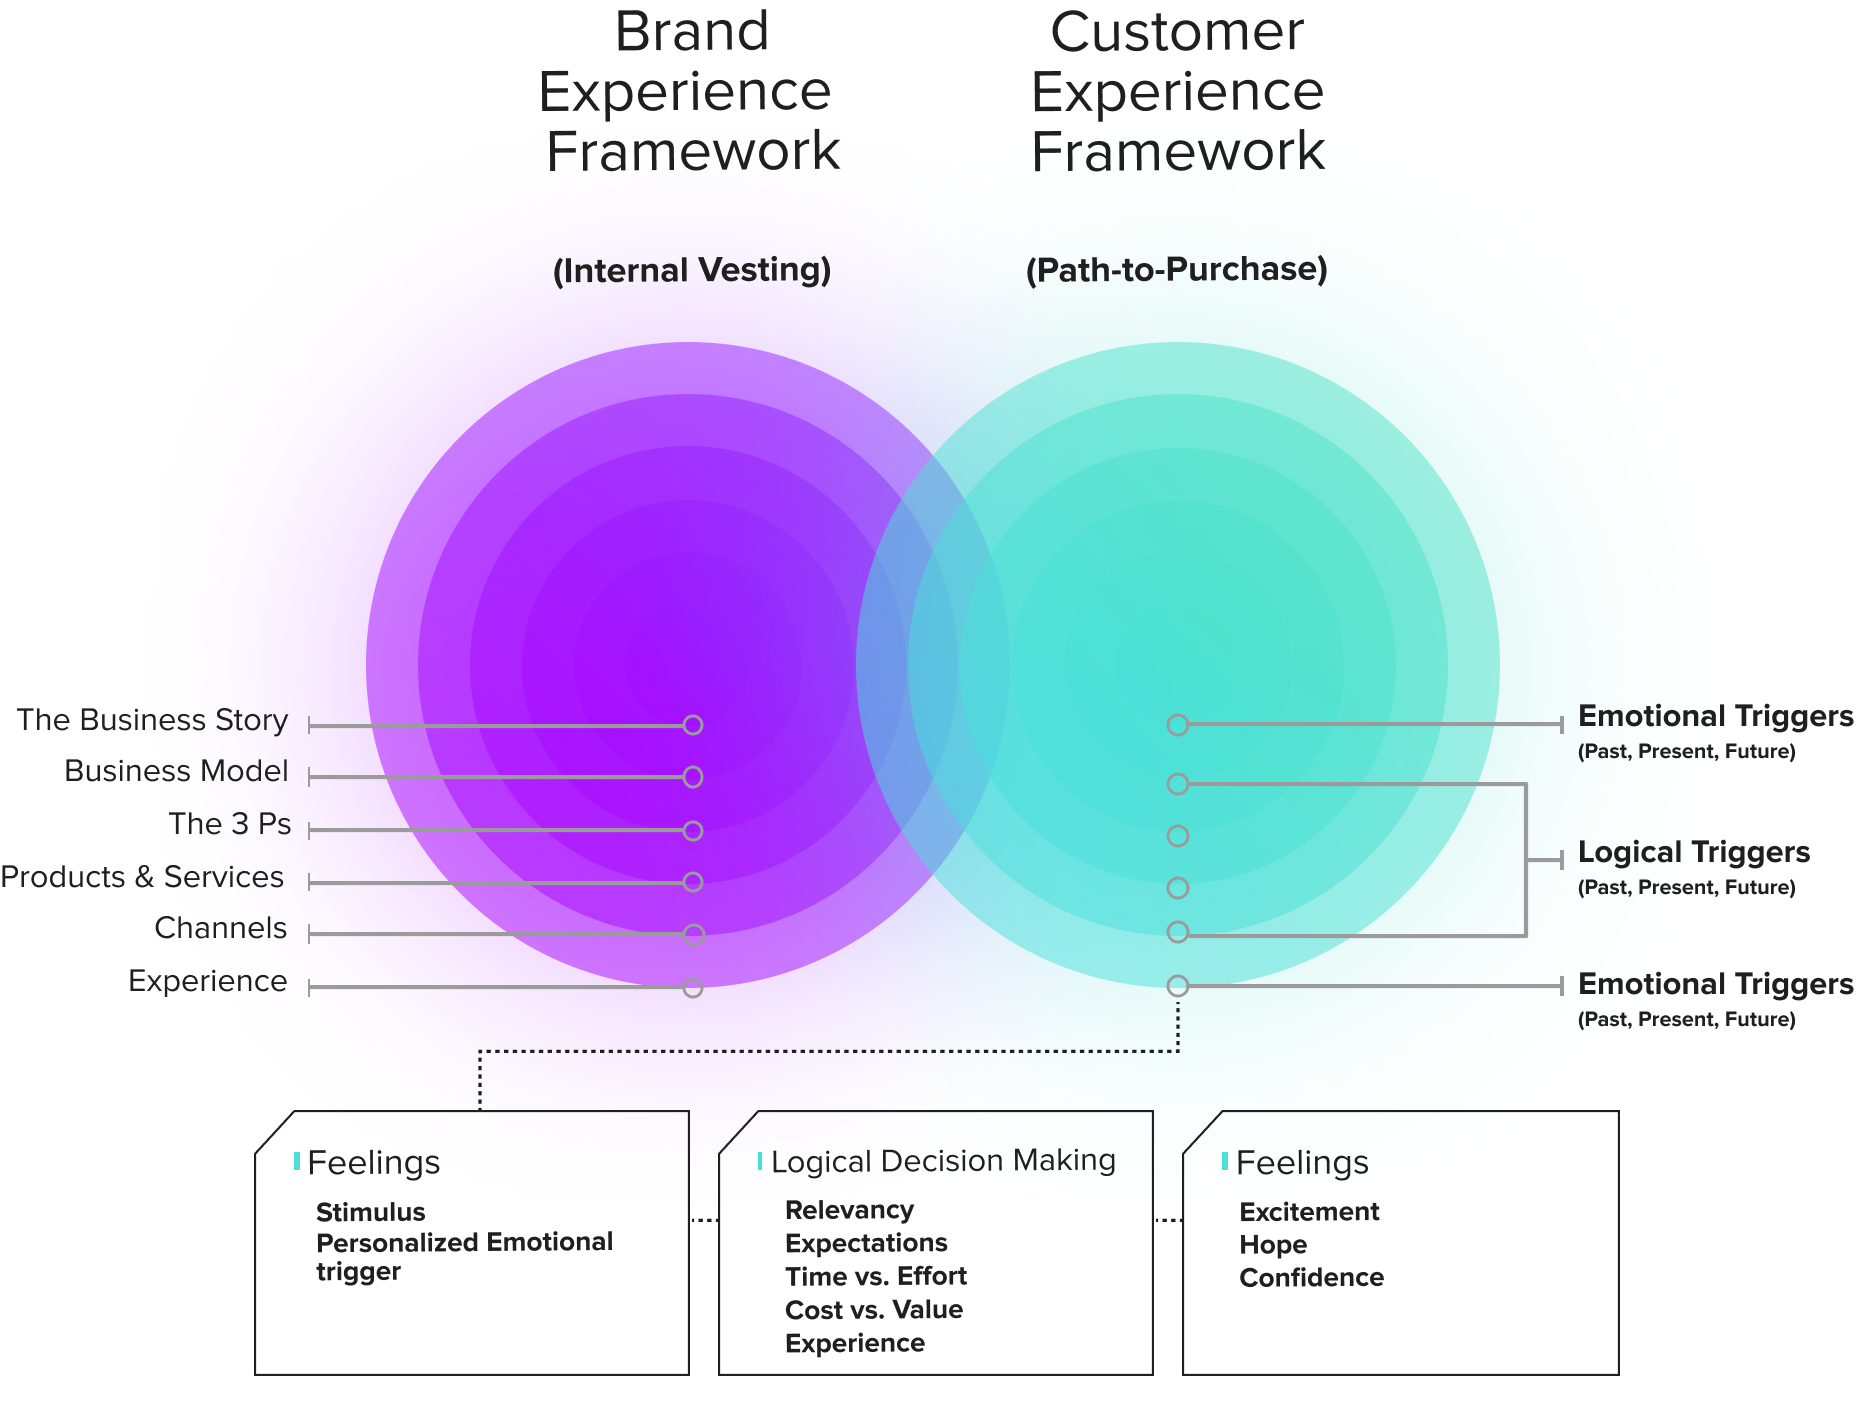
This approach starts with empathy for the buyer and for the business itself. Yet, many companies don’t honestly know or understand their company why. That “Why” may have changed numerous times over the course of time, which can cause confusion. Looking at the StoryVesting framework, which is the framework we deploy for every client at RocketSource, you can see how this ripples outward to the business model, the people, platforms, and services, the products and services themselves, the channels, and the overall experience. In this instance, we have to start by unpacking why those changes occurred and their impact over time.
After digging deep into why the transformation happened over time, it often becomes clear that there’s a disconnect between the various players on the team. Different people in the company have different opinions about what happened because they’re looking at the data through different lenses. Democratizing the data and looking at it through the same emotional lens of the company why allows teams to get back on the same proverbial page when deciding about the best next steps forward toward growth.
It’s important to put up some guardrails and approach data more intentionally through a framework to achieve that goal.
The Importance of Leveraging a Framework for Data Democratization
Whenever we enter a new project, such as growth marketing, ROAS optimization, or customer journey mapping, we start in an unexpected place — with the team. Having conversations with employees at all levels of the organization might not seem like a common place to start when the goal is to increase growth in the market, but it’s a critical one if teams are going to get that strategy right. Here’s why.
StoryVesting is the framework we use for everything we do at RocketSource. It’s the lens through which we approach new strategies, form new plans, and create new marketing plans for our clients.
If you’re not familiar with this framework yet, we highly recommend carving out some time to dig deep into the many intricacies and layers in the post written by its creator. For now, here’s what you need to know — at its core, teams must be well-versed in the company’s why, business model, and how those align with the 3 Ps — people, processes and platforms. To understand how well an organization is aligned in these areas, we must dig into what’s happening internally across each department.
Everything Starts With the Employee’s Experience
On the business experience side of the equation, teams must clearly understand why the company exists and the business model that fuels that purpose. We often challenge team members to make a back-of-the-napkin-type approach to defining business models. While it might seem like a no-brainer task to outline how the business makes money, you’d be amazed at how different the answers are across the organization.
The reason why knowing the company’s why and business model is so crucial is that it democratizes the team’s approach. It breaks teams out of that misaligned silo-based thinking and brings teams together to work towards a common goal more cohesively. That cohesion is crucial as you decide on growth measures and bring new strategies to the market. Without having teams fully vested in the core why, they’ll struggle to understand how their work influences the greater goal of moving towards improving the North Star Metric.
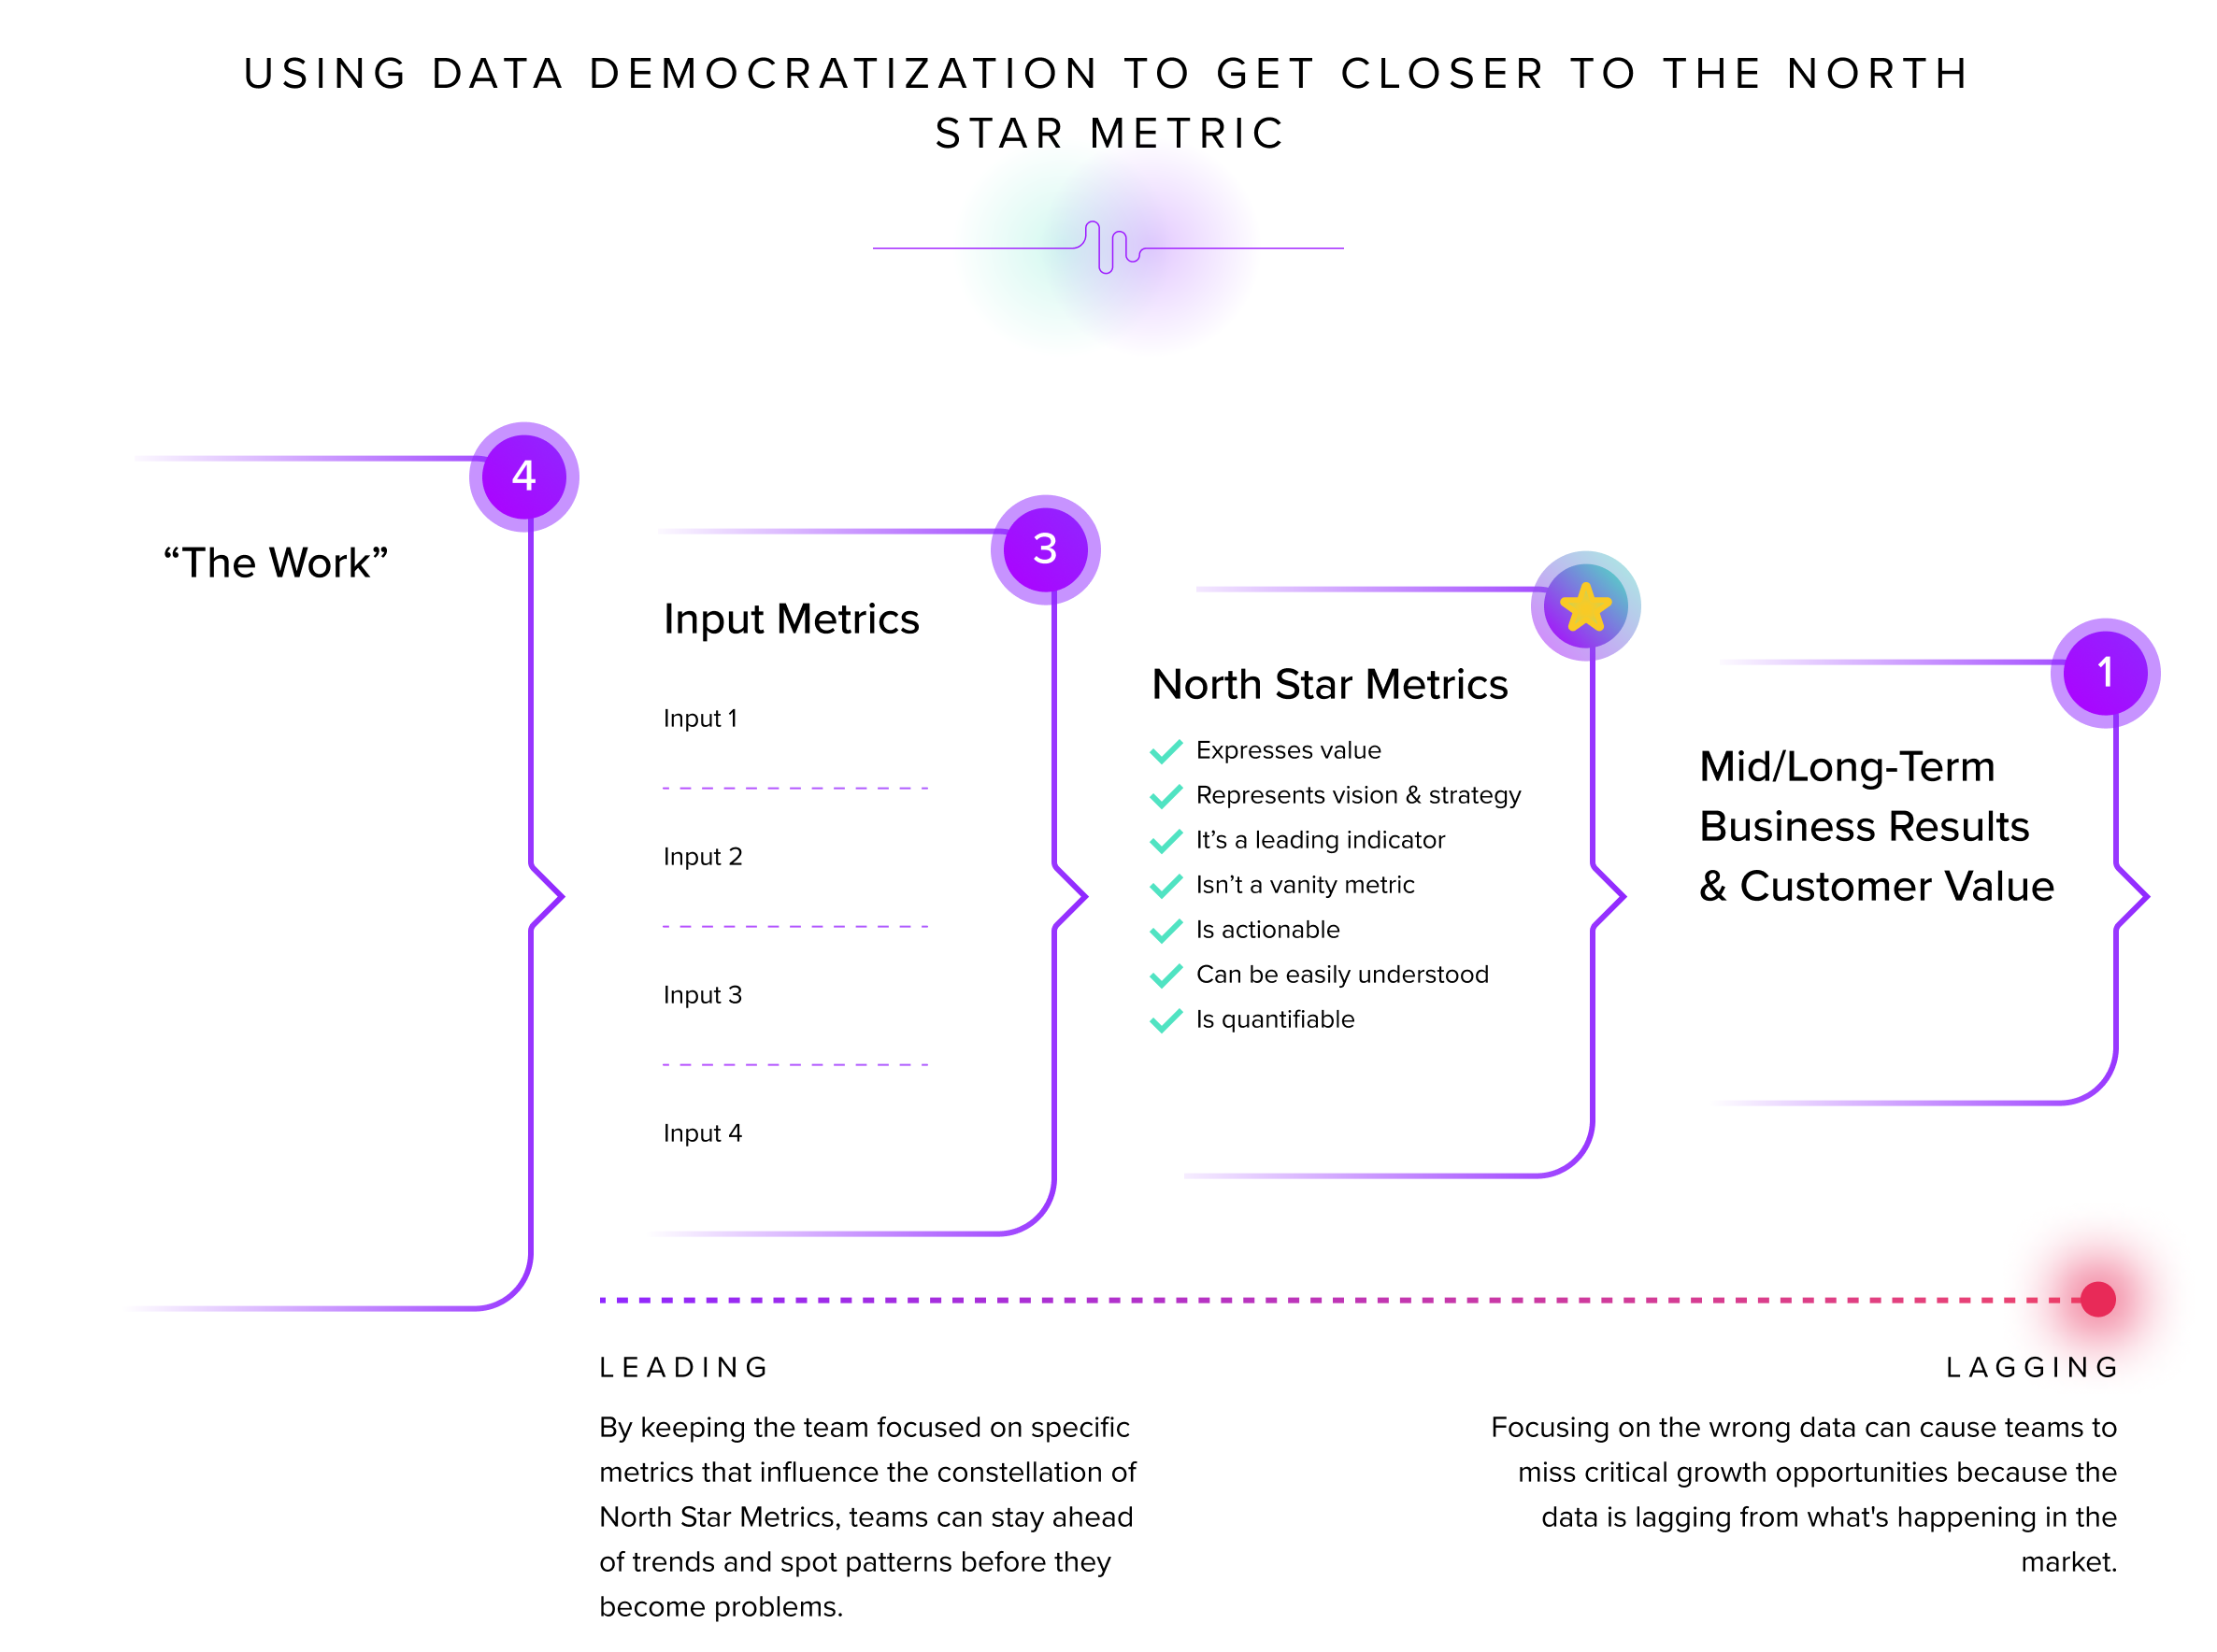
We won’t dive deep into what the North Star Metric is in this post. We have a whole post on the blog that outlines the power of a proper North Star Metric. However, we did want to draw your attention to how this constellation of metrics influences the employee’s experience with democratized data. By keeping a pulse on the input metrics, typically leading metrics that influence a change in the North Star Metrics of an organization, teams can better understand the impact of their work. Waiting for customer and business results causes a team to fall behind by relying too heavily on lagging metrics. Having everyone focused on the right input metrics will yield bigger growth and better overall results while simultaneously showing team members the impact of their work on the company.
However, getting everyone on the same page about how the organization moves towards improving the North Star Metric is no easy feat. You’ll get various responses to the same questions when interviewing multiple employees. A few of the questions we like to focus on around the business model are:
- Who are your customers?
- What do your customers think of your brand?
- How do you reach your customers?
- How does your organization make money?
- Why is this company in business?
- How does each brand within the organization make money?
As we start the questioning process of each employee with these and other questions, we simultaneously drill down into the areas of insight that the employee has about the organization. This allows the team members to flex into their expertise and give us more qualitative insights into what they think, feel, say and do daily to move the organization further up the S Curve of Growth.
These surveys are always done face-to-face or on video. There’s an art and science for how it gets done. We have to read the room. When we hit record, we have to take note of their response. Some people hesitate and worry that their answers will get them in trouble with a stakeholder. Others go down the wrong lane with silo-based thinking, which requires us to get them back to the center to think about the company as a whole.
As we sift through the results, we must read between the lines. What did the team say? What were they trying to say? This data is the most important qualitative data we can gather because it lets us put our ears to the ground internally to ensure alignment among the team. That alignment directly translates to clearer messaging, better product development, and increased LTV in the market. Without it, we cannot truly navigate how to navigate best the rest of the StoryVesting framework — product and service development, channels, and the overall experience.
Democratizing EX Data to Gain CX Insights
Through our questioning approach, we’ve found a wide range of responses from employees who each seem to have a different concept about how the company makes money and goes to market. In thinking about this question-and-answer session through the lens of data democratization, it becomes clear that teams must start getting on the same page. Without access to the same data, they will continue to work in silos, stunting their ability to navigate their journey alongside the customer. This is especially true regarding retention, which is the first thing we focus on improving in any growth measure.
As we spot misalignments internally, we can move to the other side of the StoryVesting framework and start looking at the customer’s emotional and logical triggers that move them through their journey toward the purchase and well beyond. This is where the magic unfolds, and data democratization becomes exponentially more important.
As we mentioned before, we always start with retention in mind. Keeping current customers happy lets us understand what the market needs, what will drive bigger long-term growth, and how to reach our current buyers. Ultimately, it lets us tell a better story based on the data — data that starts with what the team is working towards internally.
As we approach this step, we often find that the same misalignment of silo-based thinking, lack of a human-centric approach, and analyzing the wrong data spill over into the growth tactics needed to buoy a business. Website tones are aimed at investors rather than customers. UX/UI is disjointed because the goals at each point of the customer’s journey are misaligned. The logic in how and where products and services are delivered is misaligned too.
In sitting shoulder-to-shoulder with team members, it becomes clear that without gathering data and democratizing the story it is telling to work towards a singular common goal, teams will continue to operate in a disjointed fashion. That lack of cohesion can make it enormously difficult to develop roadmaps, create clear positioning in the market, and build a user journey that drives growth while lowering costs.
Gathering and Democratizing Data in a World Where Analytics are Hard to Come By
Before we can even touch data democratization, we must acknowledge the elephant in the room. Tremendous shifts are taking place regarding what we can do with analytics. Gone are the days of basic overviews regarding consumer behavior. Gone are the days when businesses used analytics to move customers through the pre-purchase and post-purchase funnels like cogs in a system. Today’s analytics are far more robust.
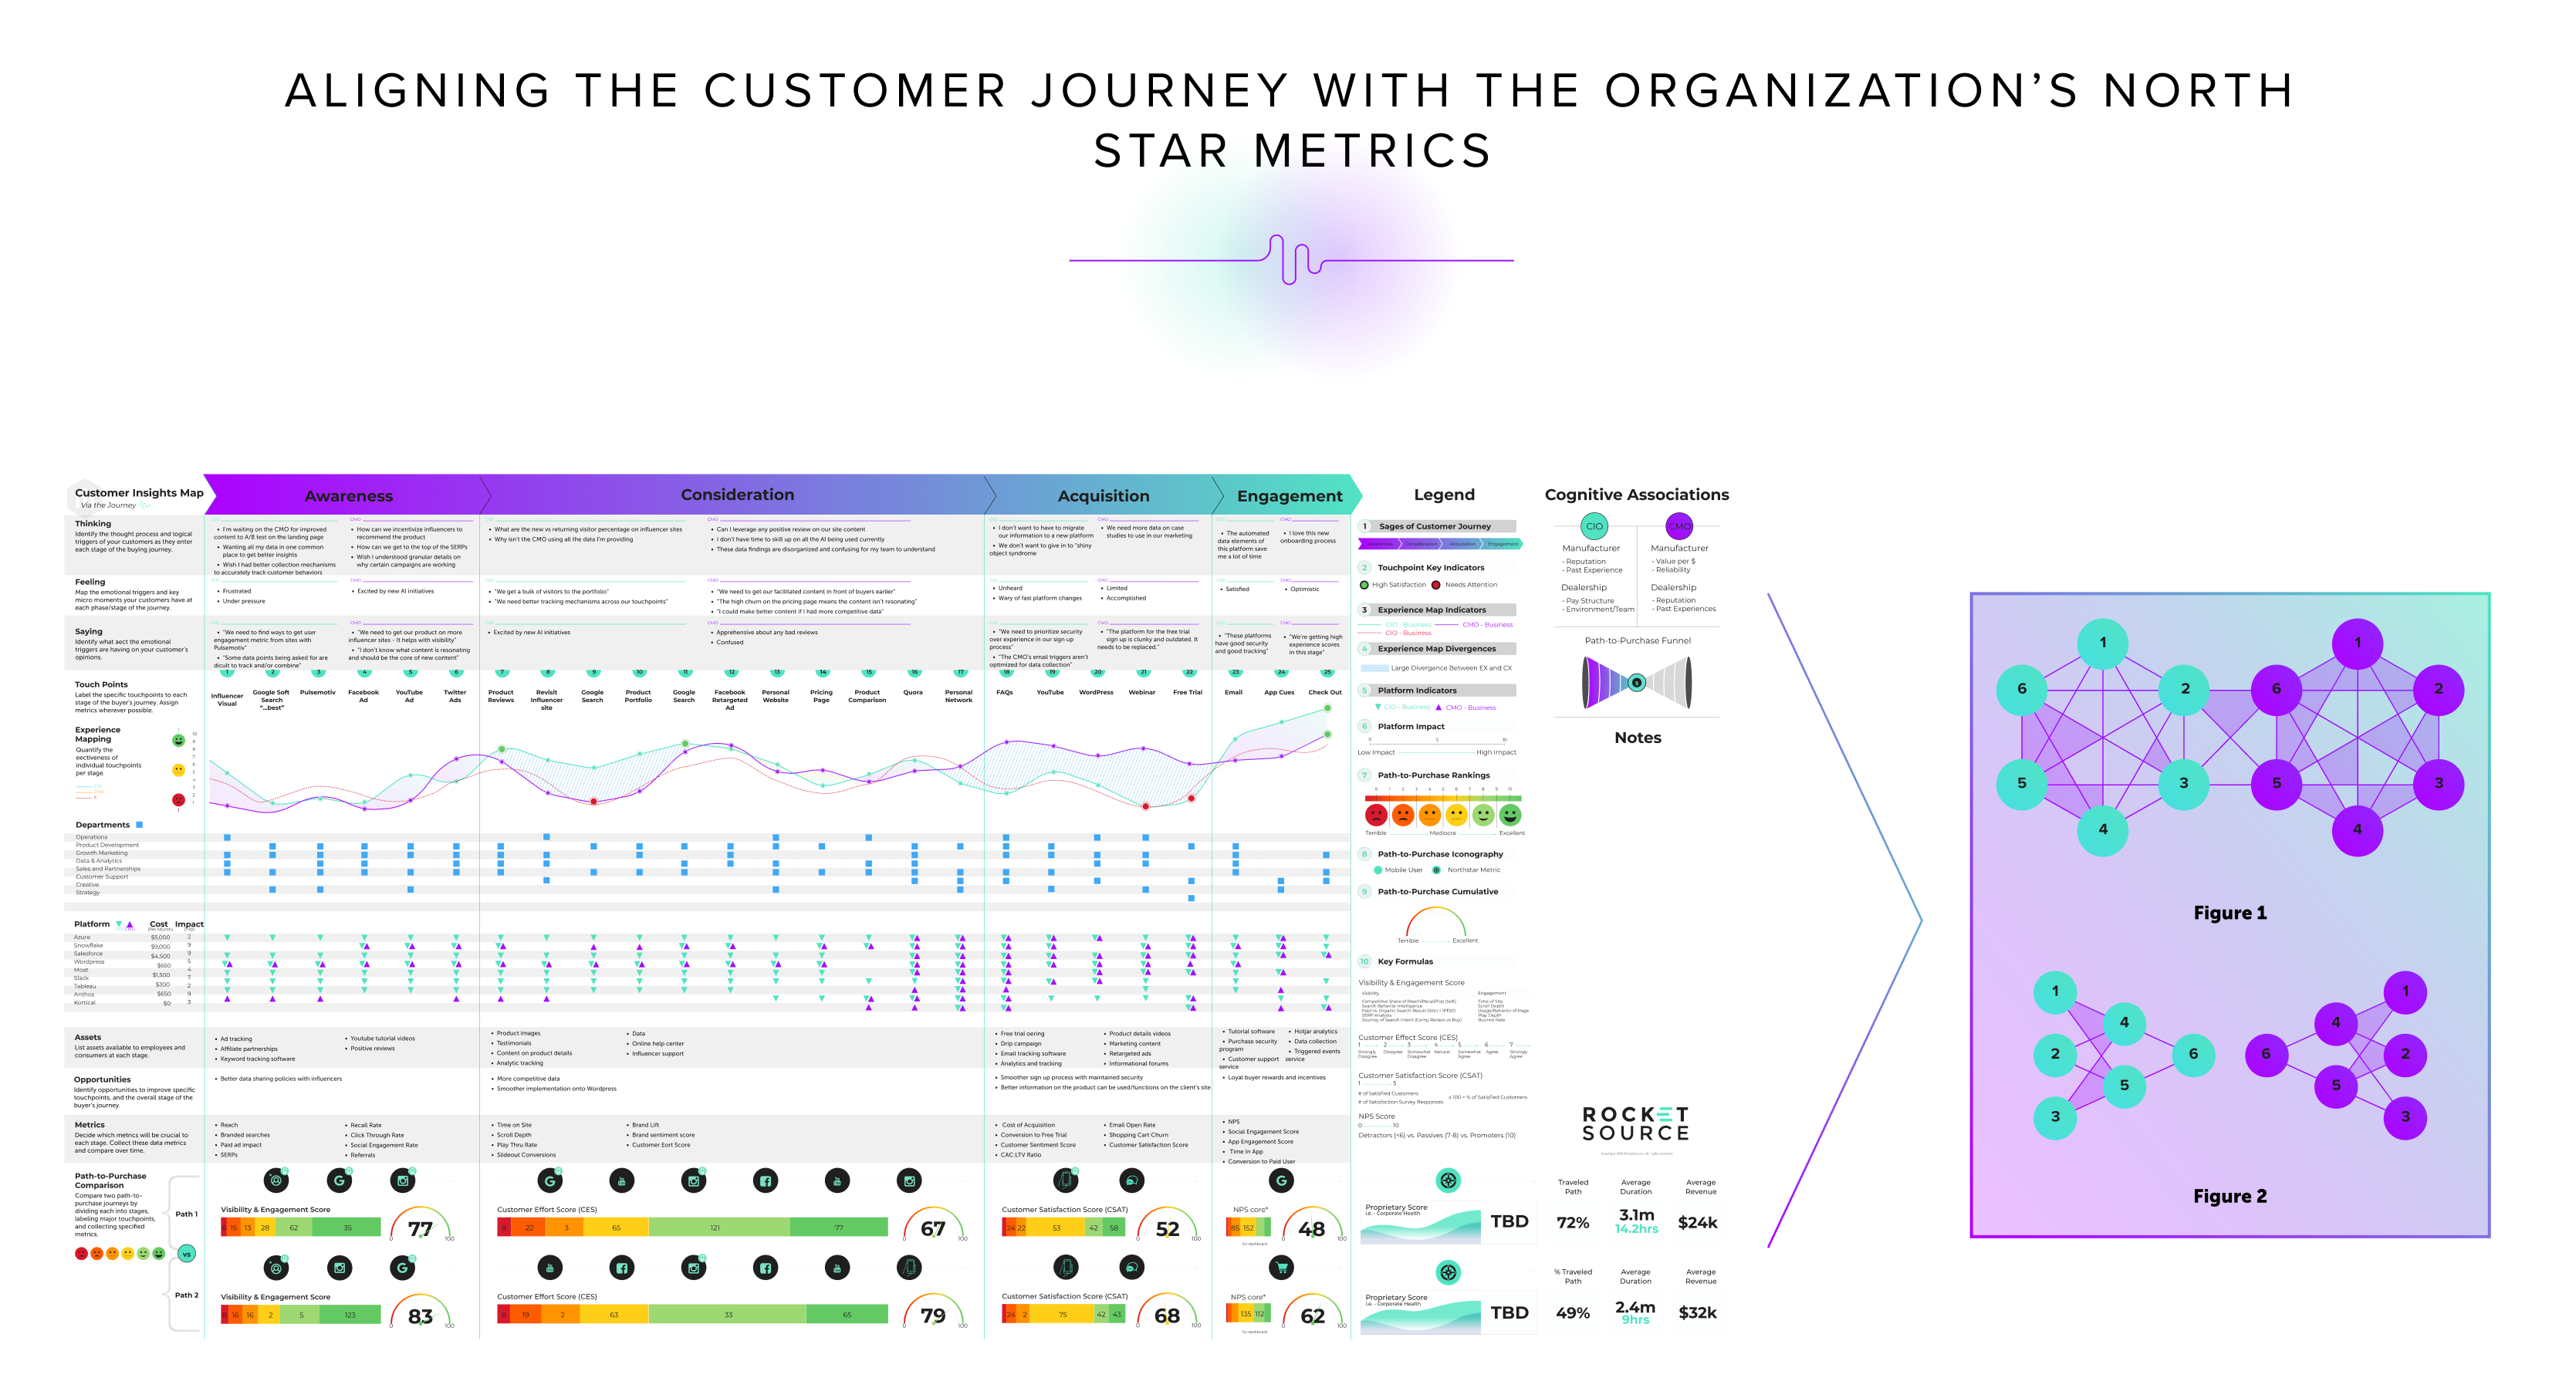
The next version of analytics is an event-based architecture. This event-driven approach will significantly change how and where companies appear to their audience. The next iteration of analytics will look at the customer’s journey and the events happening inside it. From there, it will take the clicks, triggers, time on site, session data, and so much more and then transform it into a digestible insights map to give the entire organization a better understanding of what’s happening inside. Here’s an example of what it will look like.
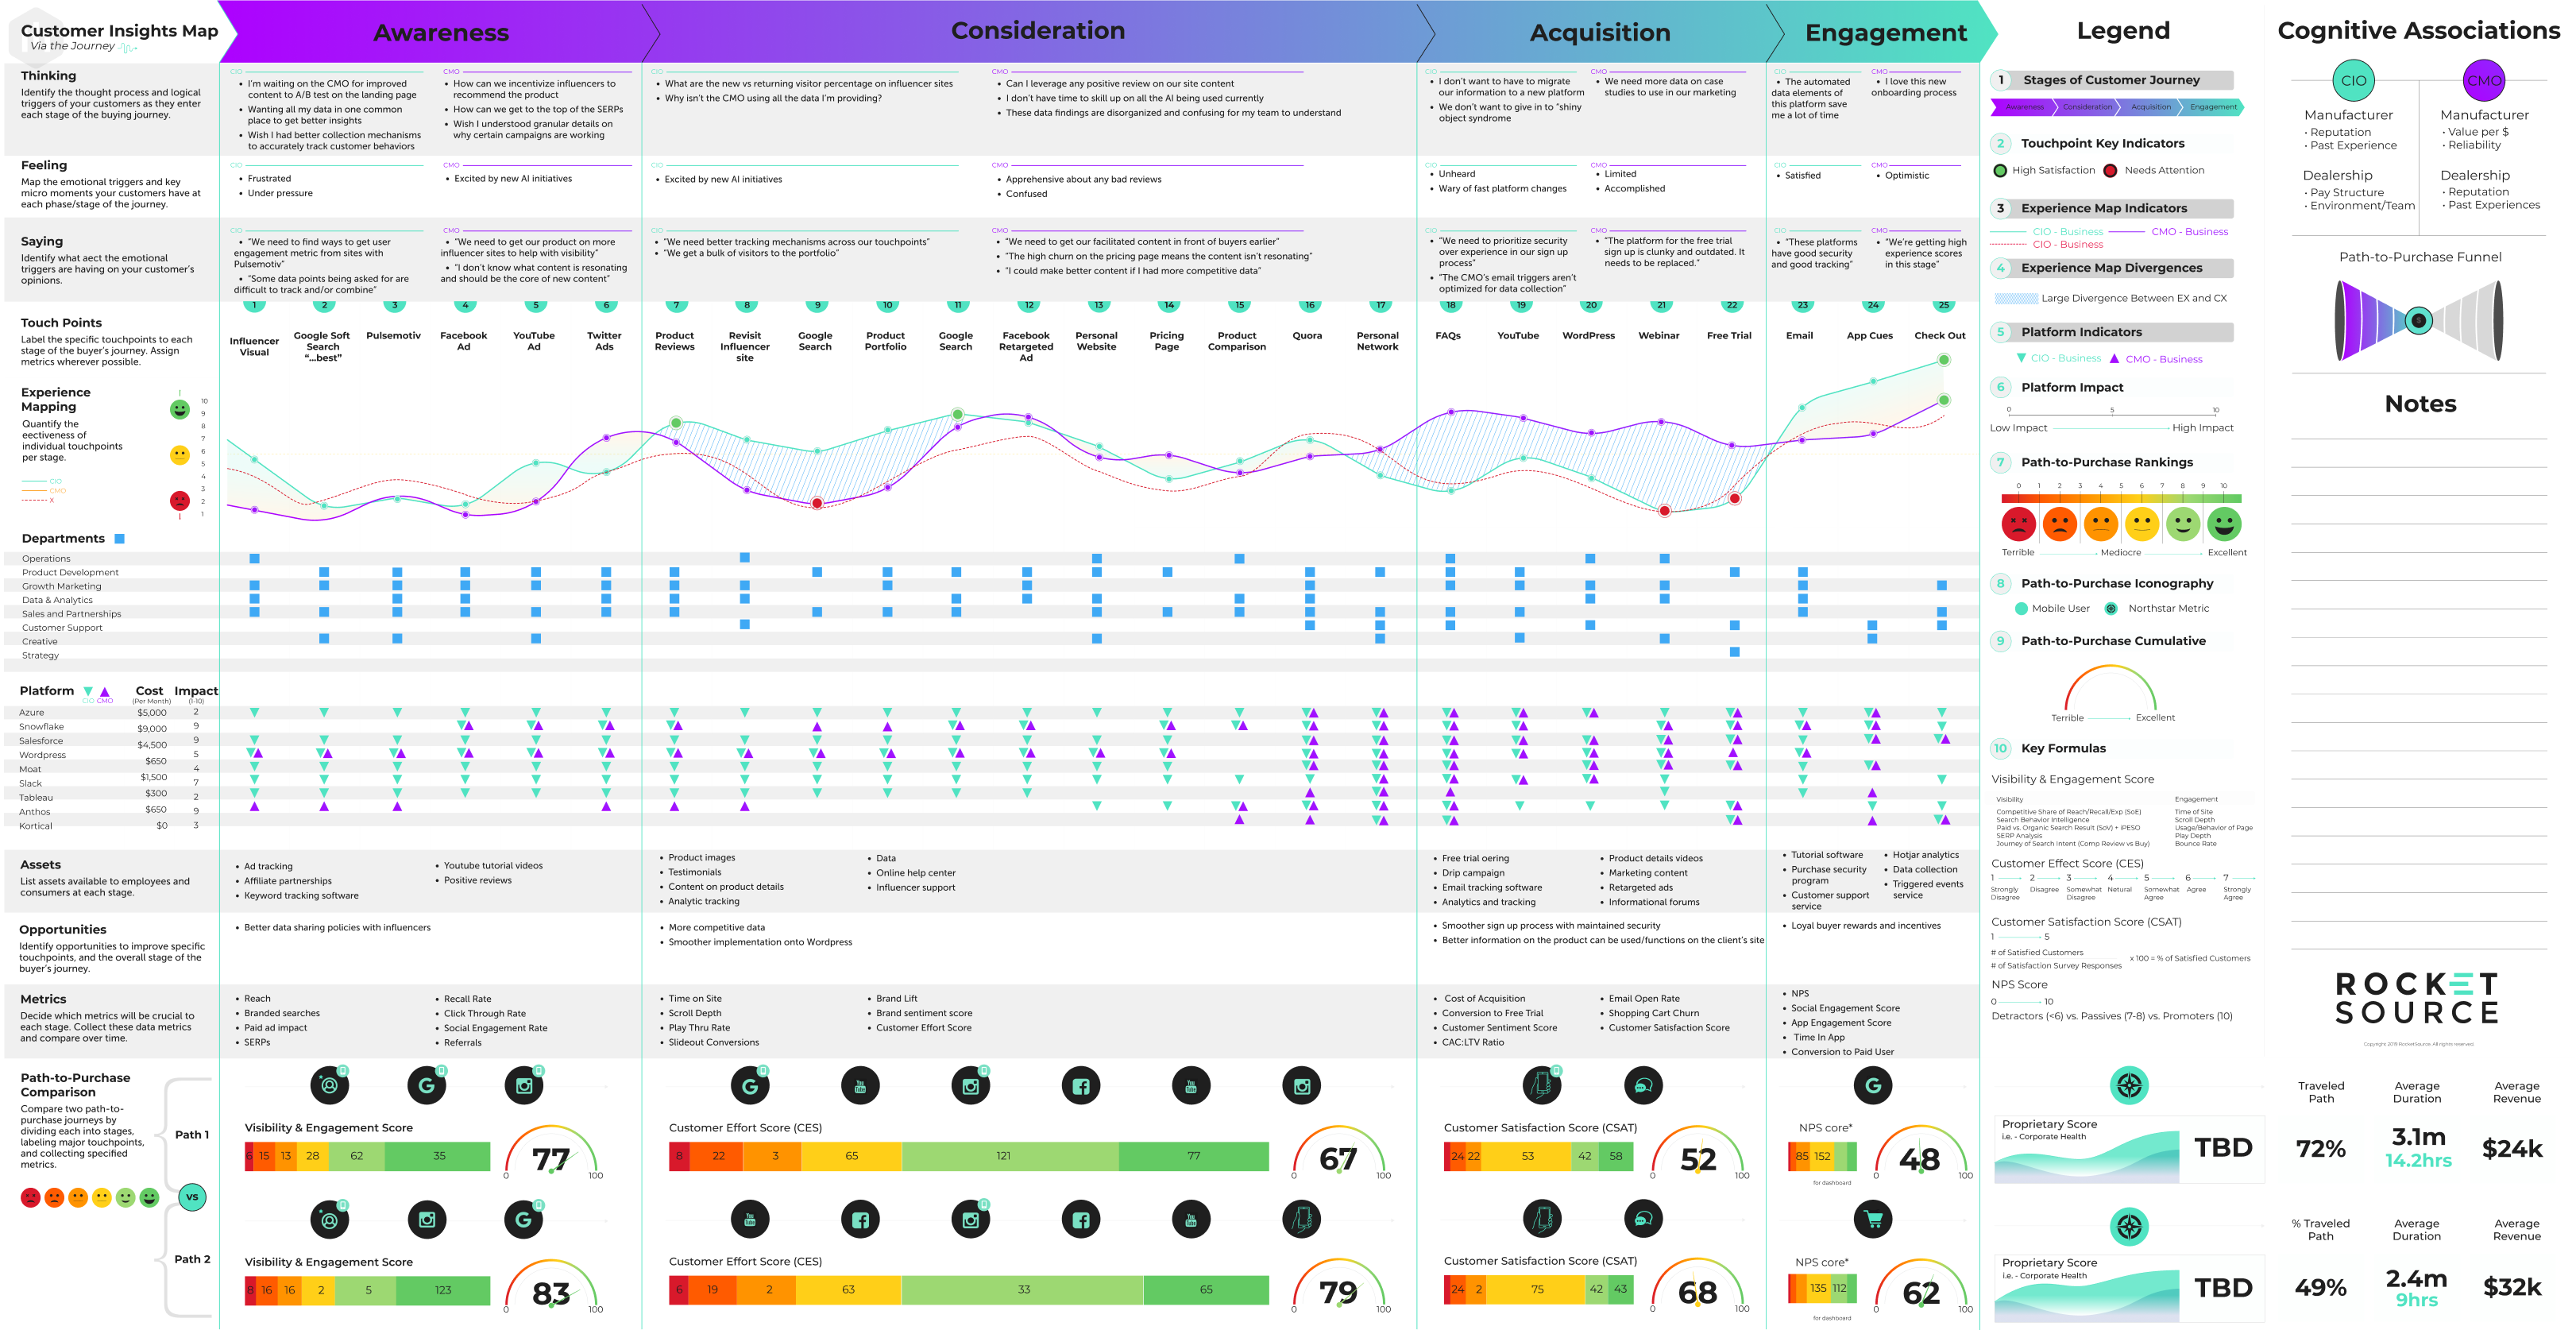
What you see here is our proprietary Customer Insights Map. We have broken down the man intricacies and nuances of this map in our post, Transforming the Digital Experience via Customer Journey Mapping. While we won’t go into detail about all of those nuances again here, it’s a good idea to carve out some time to dig into what’s under the hood of this data visualization.
Knowing how to properly and adequately look at the many pathways involved inside a customer’s journey from awareness around a product to the level of brand ambassadorship that spurs word-of-mouth growth, is tricky. It becomes even trickier when you note that we’re in an era of over-the-top data governance and cookie consent policies. While companies still want to have as much data as possible to make decisions around the customer’s journey, the reality is that we’re soon going to live in a zero-cookie world. That begs the question:
If you can’t track the customer, then what are you going to do?
This is a tremendously difficult question facing organizations today in two big ways — the right to be forgotten and Google’s move towards Google Analytics 4 (GA4).
You Have the Right to Be Forgotten
If you have any departments across the EU, or if you’ve followed the news on General Data Protection Regulation (GDPR), you’ve probably heard the phrase “the right to be forgotten.” This phrase is exactly what it sounds like — consumers can say that they want companies to forget them by erasing their personal data.
Article 17 of the GDPR says:
The data subject shall have the right to obtain from the controller the erasure of personal data concerning him or her without undue delay and the controller shall have an obligation to erase personal data without undue delay.
Organizations are responsible for removing personal data upon request within a reasonable timeframe. Usually, that timeframe is approximately one month. After that month, the organization loses the ability to compare year-over-year data and track consumer behavior. Worse yet, it becomes difficult for the team to look at the impact downstream and adequately build marketing audiences. Building firmographic data and a database for an audience becomes very difficult without knowing who to target and who’s arriving on your website. This becomes exasperated as you consider the implications of the move away from Google’s Universal Analytics to Google Analytics 4.
Retaining Data Integrity in the Move to Google Analytics 4
Right now, Google acts as a data warehouse for millions of businesses around the globe. They no longer want to be that data warehouse, so they are transitioning to a new platform — Google Analytics 4 [GA4].
According to Google, this is a new kind of property that will work across websites and applications to track event-based data rather than session data. Rather than storing user data on their analytics profile, large organizations must transition to cloud data warehouses like BigQuery. For organizations to align past information about events with current information about events, teams must update their data dictionaries and redefine the data to gather Year-over-Year data and map convergence divergence bands correctly.
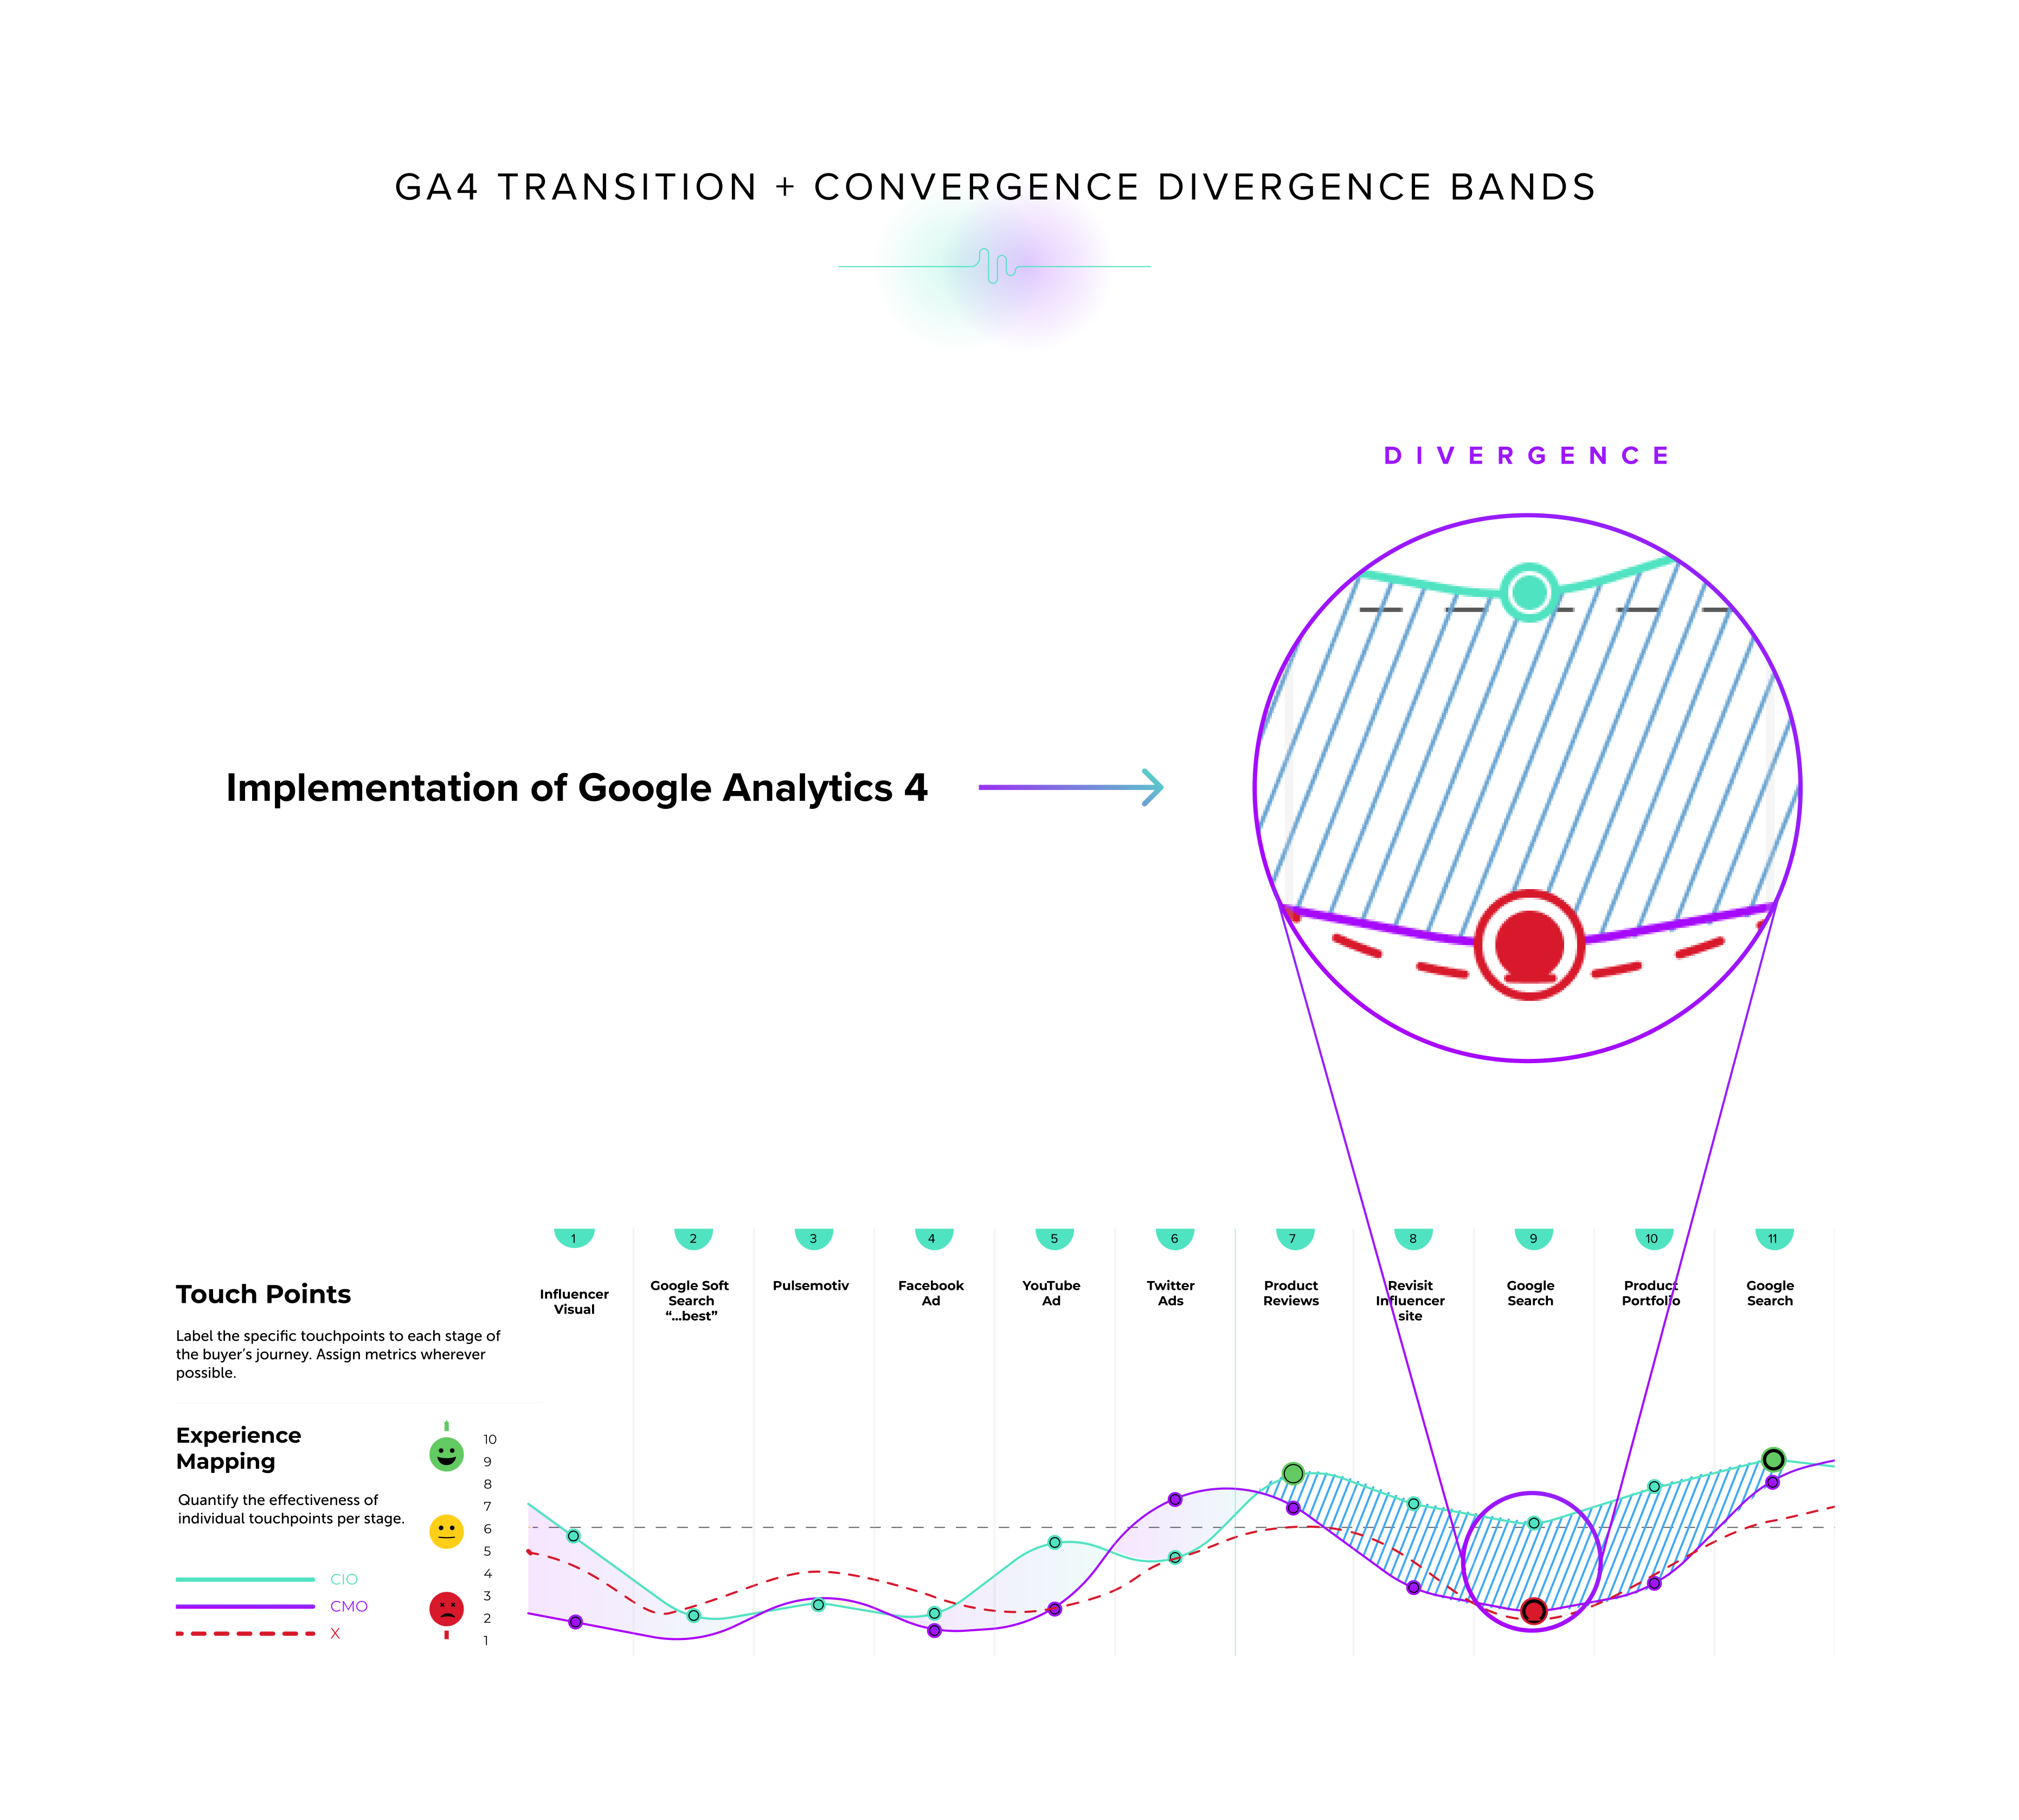
Convergence divergence bands, or Barlow Bands as we sometimes call them at RocketSource, tell a strong story about what’s happening in the customer journey due to how our co-founder Buckley Barlow leveraged these in our Customer Insights Map (CIM). In positioning two data points, such as year-over-year trends or customer and employee experience scores along the customer journey, as we do on our CIM, you can quickly spot areas that require attention. When the two lines converge or come together, something that could be positive or negative happens at that point. It’s worth investigating. The same thing is true when two lines diverge or pull apart. Something is happening at that specific micro point that requires attention.
Without keeping data consistent year over year or across experiences, it’s impossible to build predictive models to understand how well the organization is moving towards the North Star Metric. In maintaining the ability to track behavioral data, you can better architect an end-to-end experience that makes the journey easier for the buyer and the employees.
There are numerous ways that we’re helping organizations get around this tremendous shift in how data is collected and democratized.
One example is for organizations that need to understand what’s happening with their content prior to a customer making a purchase. If you own a leading blog, and your buyers show up on the site but can no longer track their data, you might need to implement a login system. When customers sign up and log in to view an article or watch a video, they consent to cookies. The organization can then customize the experience they receive because it can see the full customer journey come into focus.
Another prime way for content creators and organizations to better understand what’s happening along the customer journey without having all the data necessary to paint that picture is through their YouTube channel. While YouTube might not give the full rundown of time watched and areas that piqued the highest interest, organizations can strategically leverage the show notes to understand their data better and attract a crowd.
Member-based browsing behavior is just one of the ways we’re seeing the Internet shift into new data collection forms. With this new approach, it will become very difficult to view websites anonymously anymore. However, when a website or organization offers tremendous value to the visitor, there’s a much higher likelihood of value exchange regarding consent to track their behavior. When looking at this new method for understanding consumer behavior, it becomes clearer how this approach can help settle attribution issues and resolve the common internal misalignments discussed above.
Data Democratization Helps Settle Attribution Issues
Before we go too far, let us settle the score — tracking user behavior and understanding what’s happening on the other side of the screen with our buyers is still possible. However, the difference will soon become how it’s built. Once you know to build those trends, you can then know how to acknowledge another elephant in the proverbial room — attribution issues.
Attribution gives credit to specific departments on your team for making the sale. When the customer journey isn’t properly visualized, teams have difficulty knowing where the buck stopped. When that happens, the internal finger-pointing begins, and a whole host of other unproductive issues rise to the surface.
To show how detrimental this can be, look no further than GameStop over the last few years.
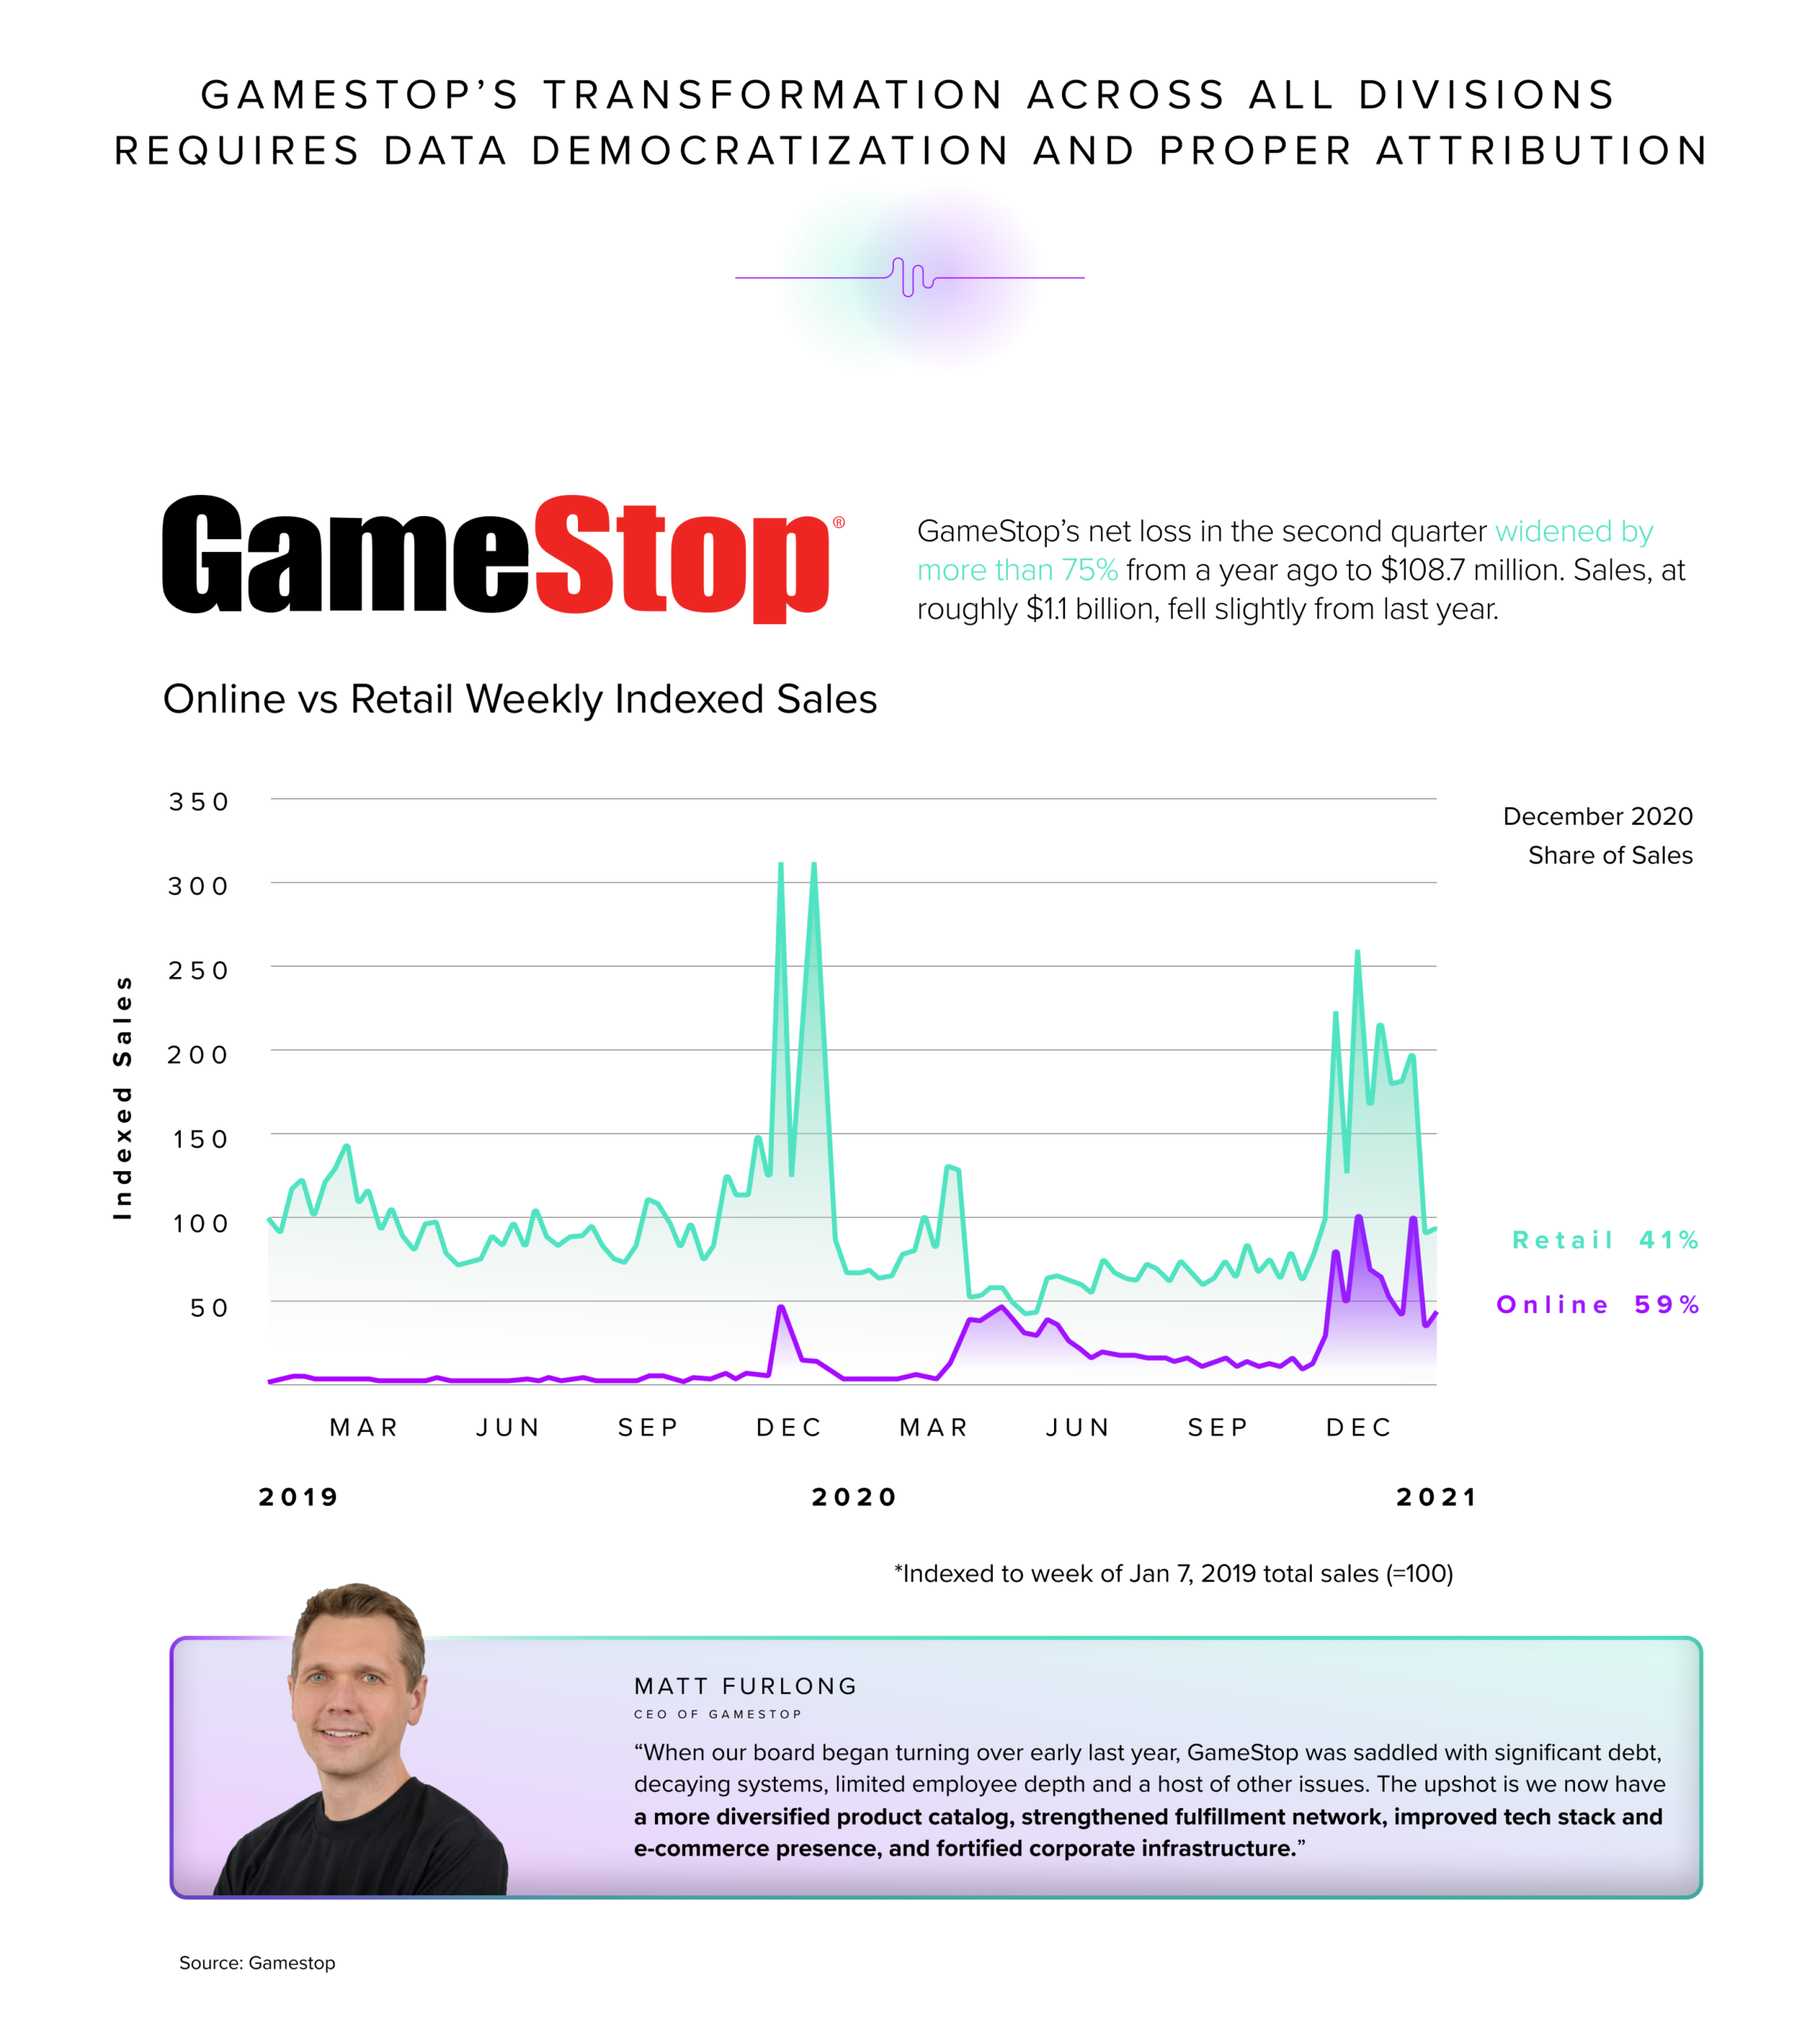
Looking at the chart above, you might assume that retail dominated sales, while online sale shares weren’t quite as strong. On the surface, you’d be correct. But charts like these beg the question — what’s happening in the customer’s journey? And are the proper departments getting the proper attribution? For example, which department gets the final sale if a customer orders something online to pick up in-store and then adds something else to their order while at the store? This type of nebulous attribution may have contributed to GameStop’s significant debt because they weren’t clear on their buyer’s path to purchase or loyalty. In the second quarter of 2022, GameStop’s net loss expanded by more than 75% yearly to a loss of $108.7 million. To help get things back on track, the popular gaming store is in the process of an overarching transformation, focusing on key areas, such as diversifying products, fulfillment networks, and more.
Like GameStop’s new leadership is quickly realizing, attribution issues and channel conflicts aren’t as cut and dry as they might seem in line charts or other data visualizations. Sharing attribution across all channels allows teams to avoid cannibalizing each other and start working together in sync. Getting there requires data democratization, so all players can operate with the same rules, knowledge, and insights.
Data Democratization Shows that Nothing is Ever in Isolation
Perhaps the biggest challenge in attribution is assuming that only one department, channel, or platform gets credit for the sale. When looking at the behavioral economics that goes alongside purchase behaviors, it’s clear that there’s much more at play than meets the eye. Most leads won’t come exclusively from Facebook or exclusively from Google anymore — one lead will more often come from both platforms.
An industry that knows this well is the insurance industry. Inside the insurance industry, you have national advertisements on television, display ads on the Internet, and agents pounding the pavement in local areas. Who gets the credit for the sale? The answer isn’t always clear, but the happiness and livelihood of the attribution impact the organizational and pay structures.
Businesses can no longer go as usual and offer stability in such a disruptive market. It takes manpower, time, attention, and of course, data. To this end, innovation is mandatory, and there are critical impending innovations in the insurance industry to solve this and other attribution model concerns.
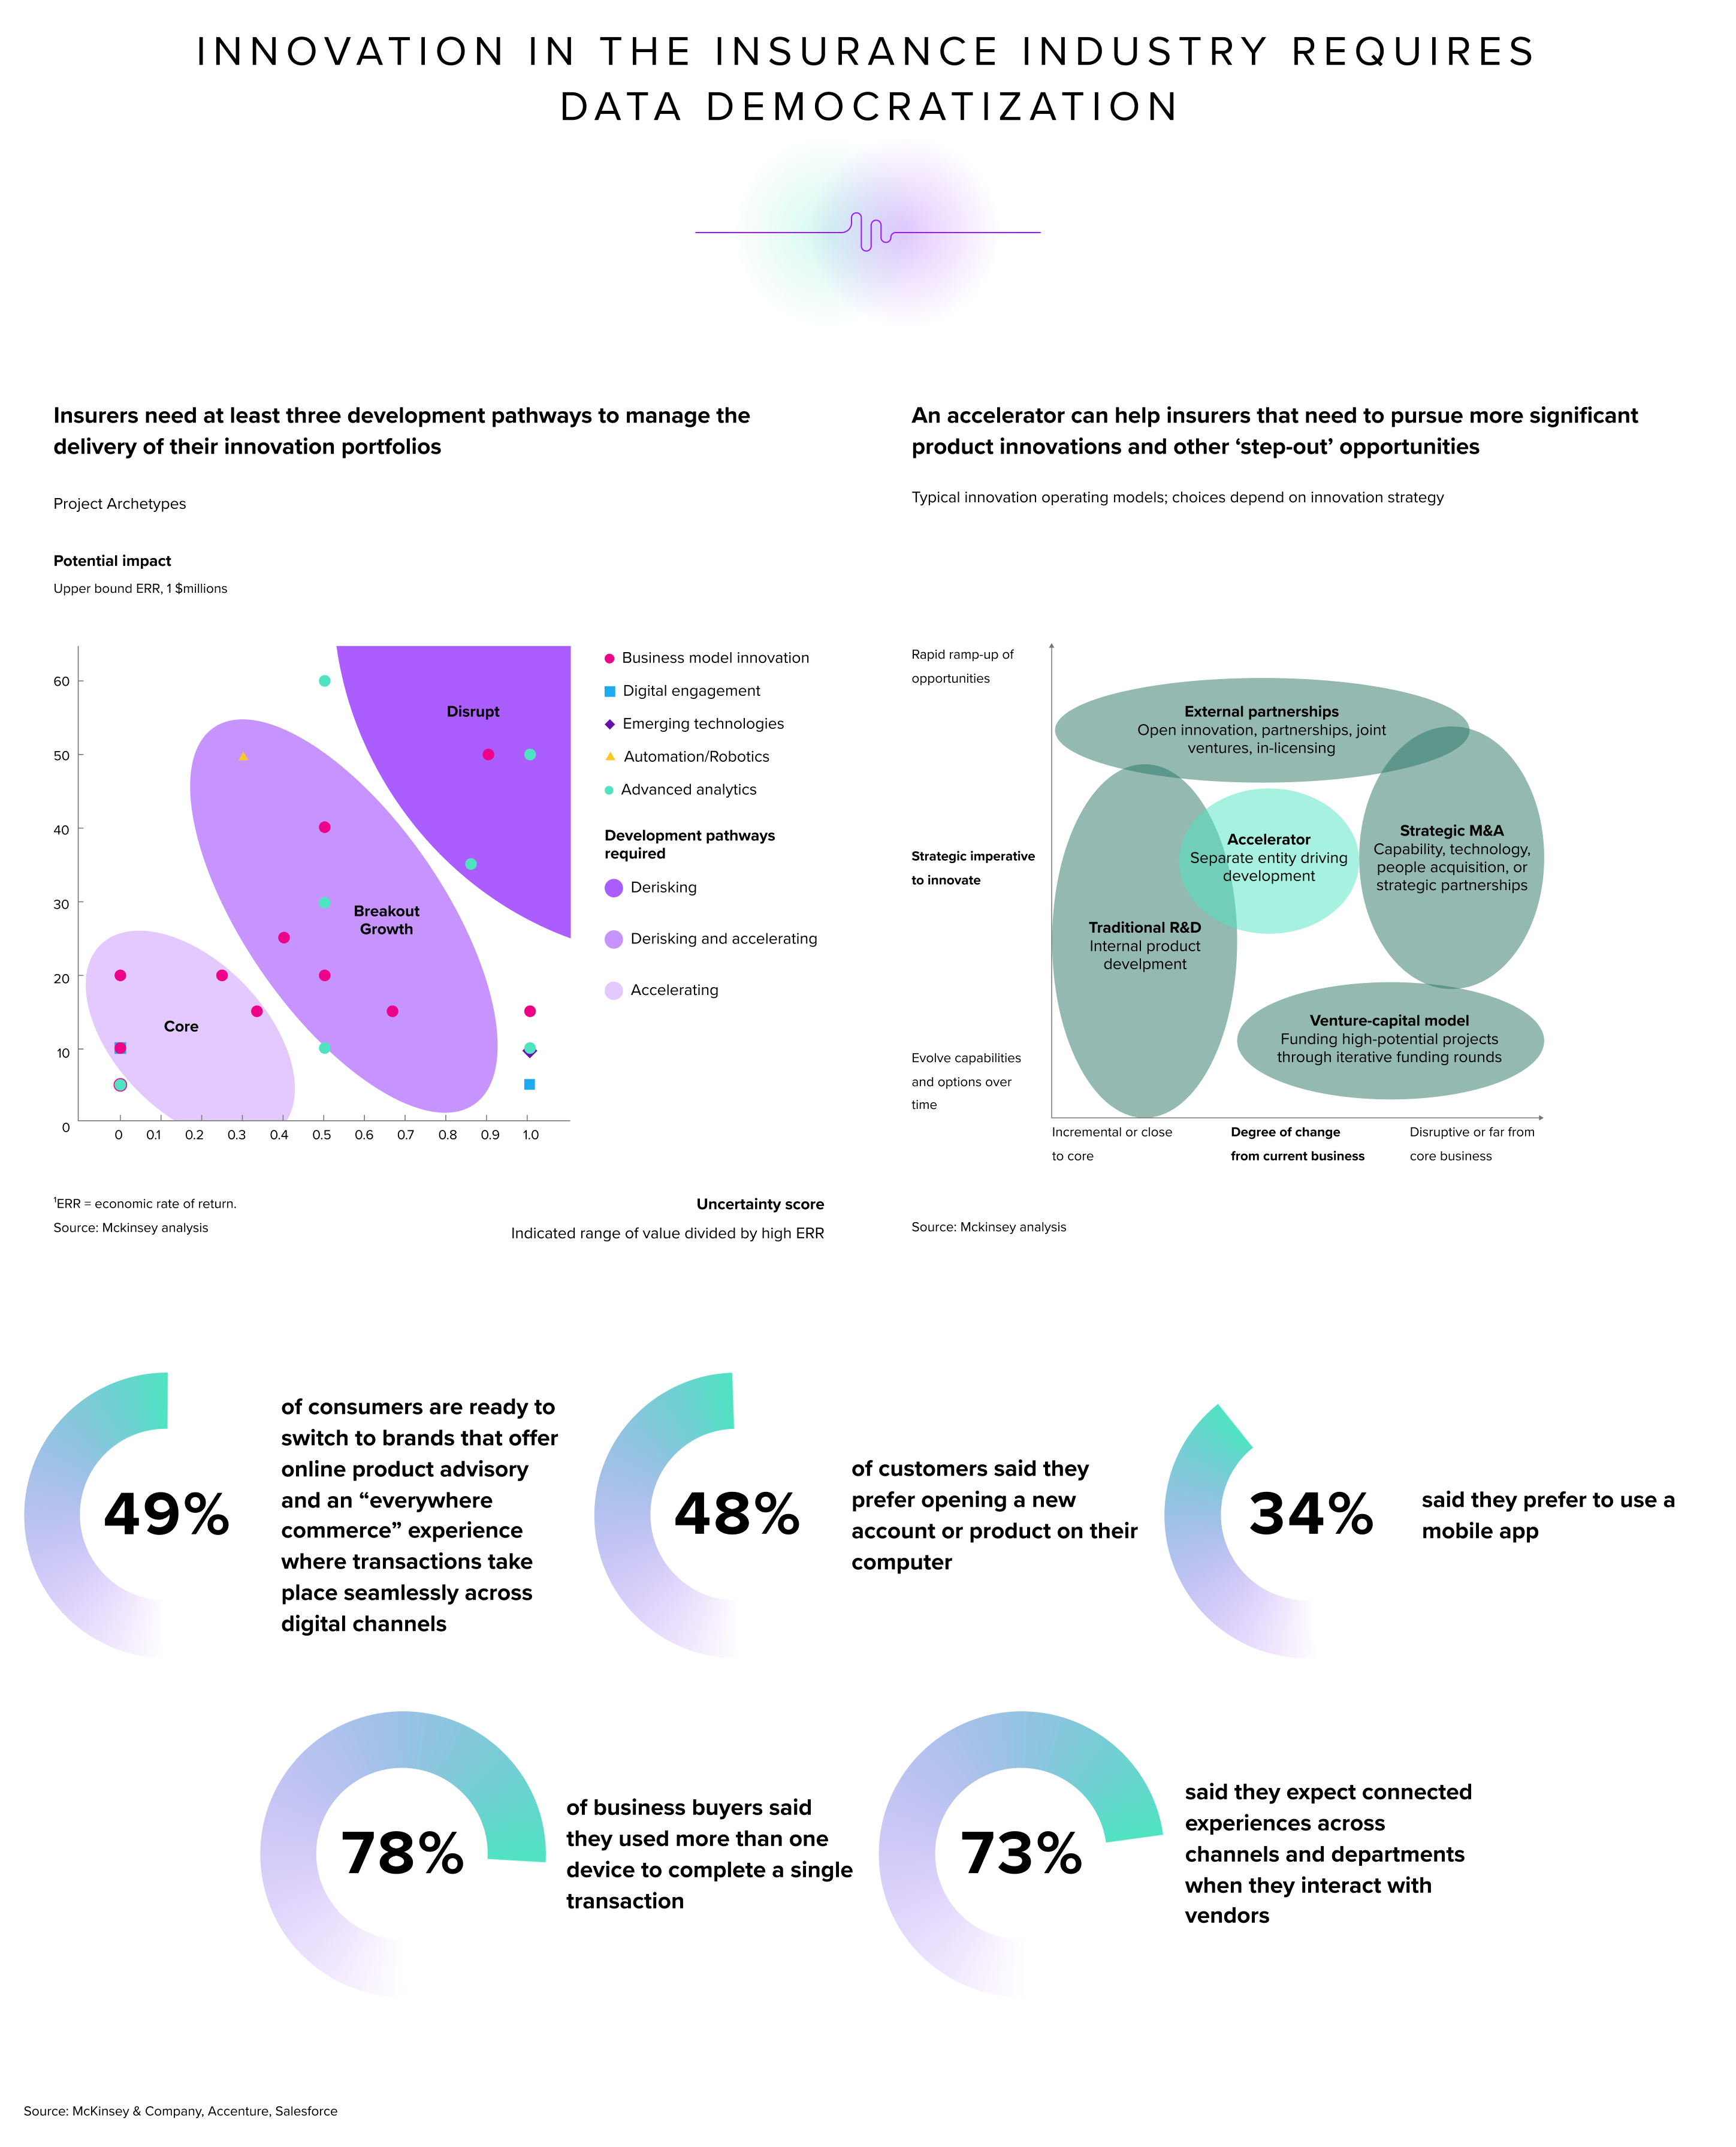
As you can see above, at the core, advanced analytics is expected to have the most significant impact to the insurance industry alone. Digital engagement and business model innovation follow closely behind. Each of these three focus areas boils down to better understanding the customer journey and using it to let team members do their job more effectively.
There are many moving components and opportunities in all industries — not just the insurance industry. Without democratizing the insights gathered, everyone will keep moving in silos, worried only about what’s happening in their lane. The growth comes when that perspective expands beyond their immediate purview, so each department helps the other.
One of the first ways to reach that goal is to start organizing data so it’s easily accessible throughout the organization. When one department holds its data and insights close to the vest, everyone misses out on the depth a central repository of information can offer. Without standardization, everyone on the team will do things differently, which can cause operations to run inefficiently and haphazardly. Breaking that information out of silos allows teams a more accessible way to get the insights needed to collectively move toward that North Star Metric with cohesion and care.
Breaking the Silos in Paid Media Attribution
Email marketing is siloed. Display advertising is siloed. 50% of the marketing budget is going to waste, but no one knows which 50% that is. No matter where we go, few teams seem to talk to each other across departments. With that said, they all want the attribution and credit for sales that come in.
What if teams started focusing more on assists rather than slam dunks to get a solid business plan in place?
We often have these conversations with clients who want to bring people out of their linear thinking and expand their view of what’s possible for the organization by linking arms. Looking holistically at the organizational structure alongside the customer’s experience, it becomes clear what the architecture needs to support those end goals.
But herein lies the problem — there’s a lack of knowledge on tracking and leveraging data correctly. Let’s look at UTM tagging as a prime example. This is a manual process that allows teams to get a foundational understanding of where traffic comes from. However, because it’s a manual process, it’s open to human error. This process is finicky regarding human error because every code must be entered in the same way to be tracked in the same way. That means that if you’re using UTM social to track Facebook leads in Google Looker Studio, and one person types in “Facebook,” another types in “Facebook.com,” and another types in “facebook,” you’ll have three separate UTMs instead of a single one.
There is no way to double-check for these manual errors either. It’s time-consuming to find them and manually combine the various tags into one area to give you the analytics needed to make sound business decisions. The more people touch these UTMs, such as paid and organic social team members, the more problematic it becomes.
This isn’t just critical to understanding UTM tags. Understanding the impact of not having standardization and democratizing the data across all departments is critical. By operating with data integrity, you’ll spend less time and money on fixing core areas and more time finding the overarching impact that these attribution channels have across the organization.
Democratizing Data is a Means to Enriching the Customer Experience
Many companies we work with have felt this at one point or another — overwhelmed by all information overload. We live in a data-rich world, yet that wealth of data means very little if no one taps into the insights waiting inside. Many companies underutilize their data because they feel analysis paralysis when they look at what’s available. Where do you start? What do you look at first? What matters, and what’s secondary?
The answers to these questions are nearly impossible to answer when you’re unsure where to look or what you’re looking for. Without a clear North Star Metric to help guide those answers, organizations don’t know how to build the infrastructure or democratize the overwhelming amount of data to understand what’s needed, what’s important, and what insights will assist in moving the needle forward. In other words:
The data needs to get out of the way and carve a path for insights.
This problem becomes more pronounced internally among team members as they’re tasked with creating a sublime customer experience. When the team is working with unknown users and looking at unknown journeys, it’s nearly impossible to understand who’s behind every touchpoint in the customer journey.
- Who are the prospective customers before they fill out a form on the website?
- How can we collect data on the people following us on social media, scanning our website, and interacting with the brand on other platforms?
- Even with data, how can we definitively understand who those people are?
Quality customer experiences go well beyond what you can see on the screen. They require that teams democratize data from every department to understand better what’s happening and what needs to be improved. Before any design gets tweaked or a new campaign gets released, we must dig into the why.
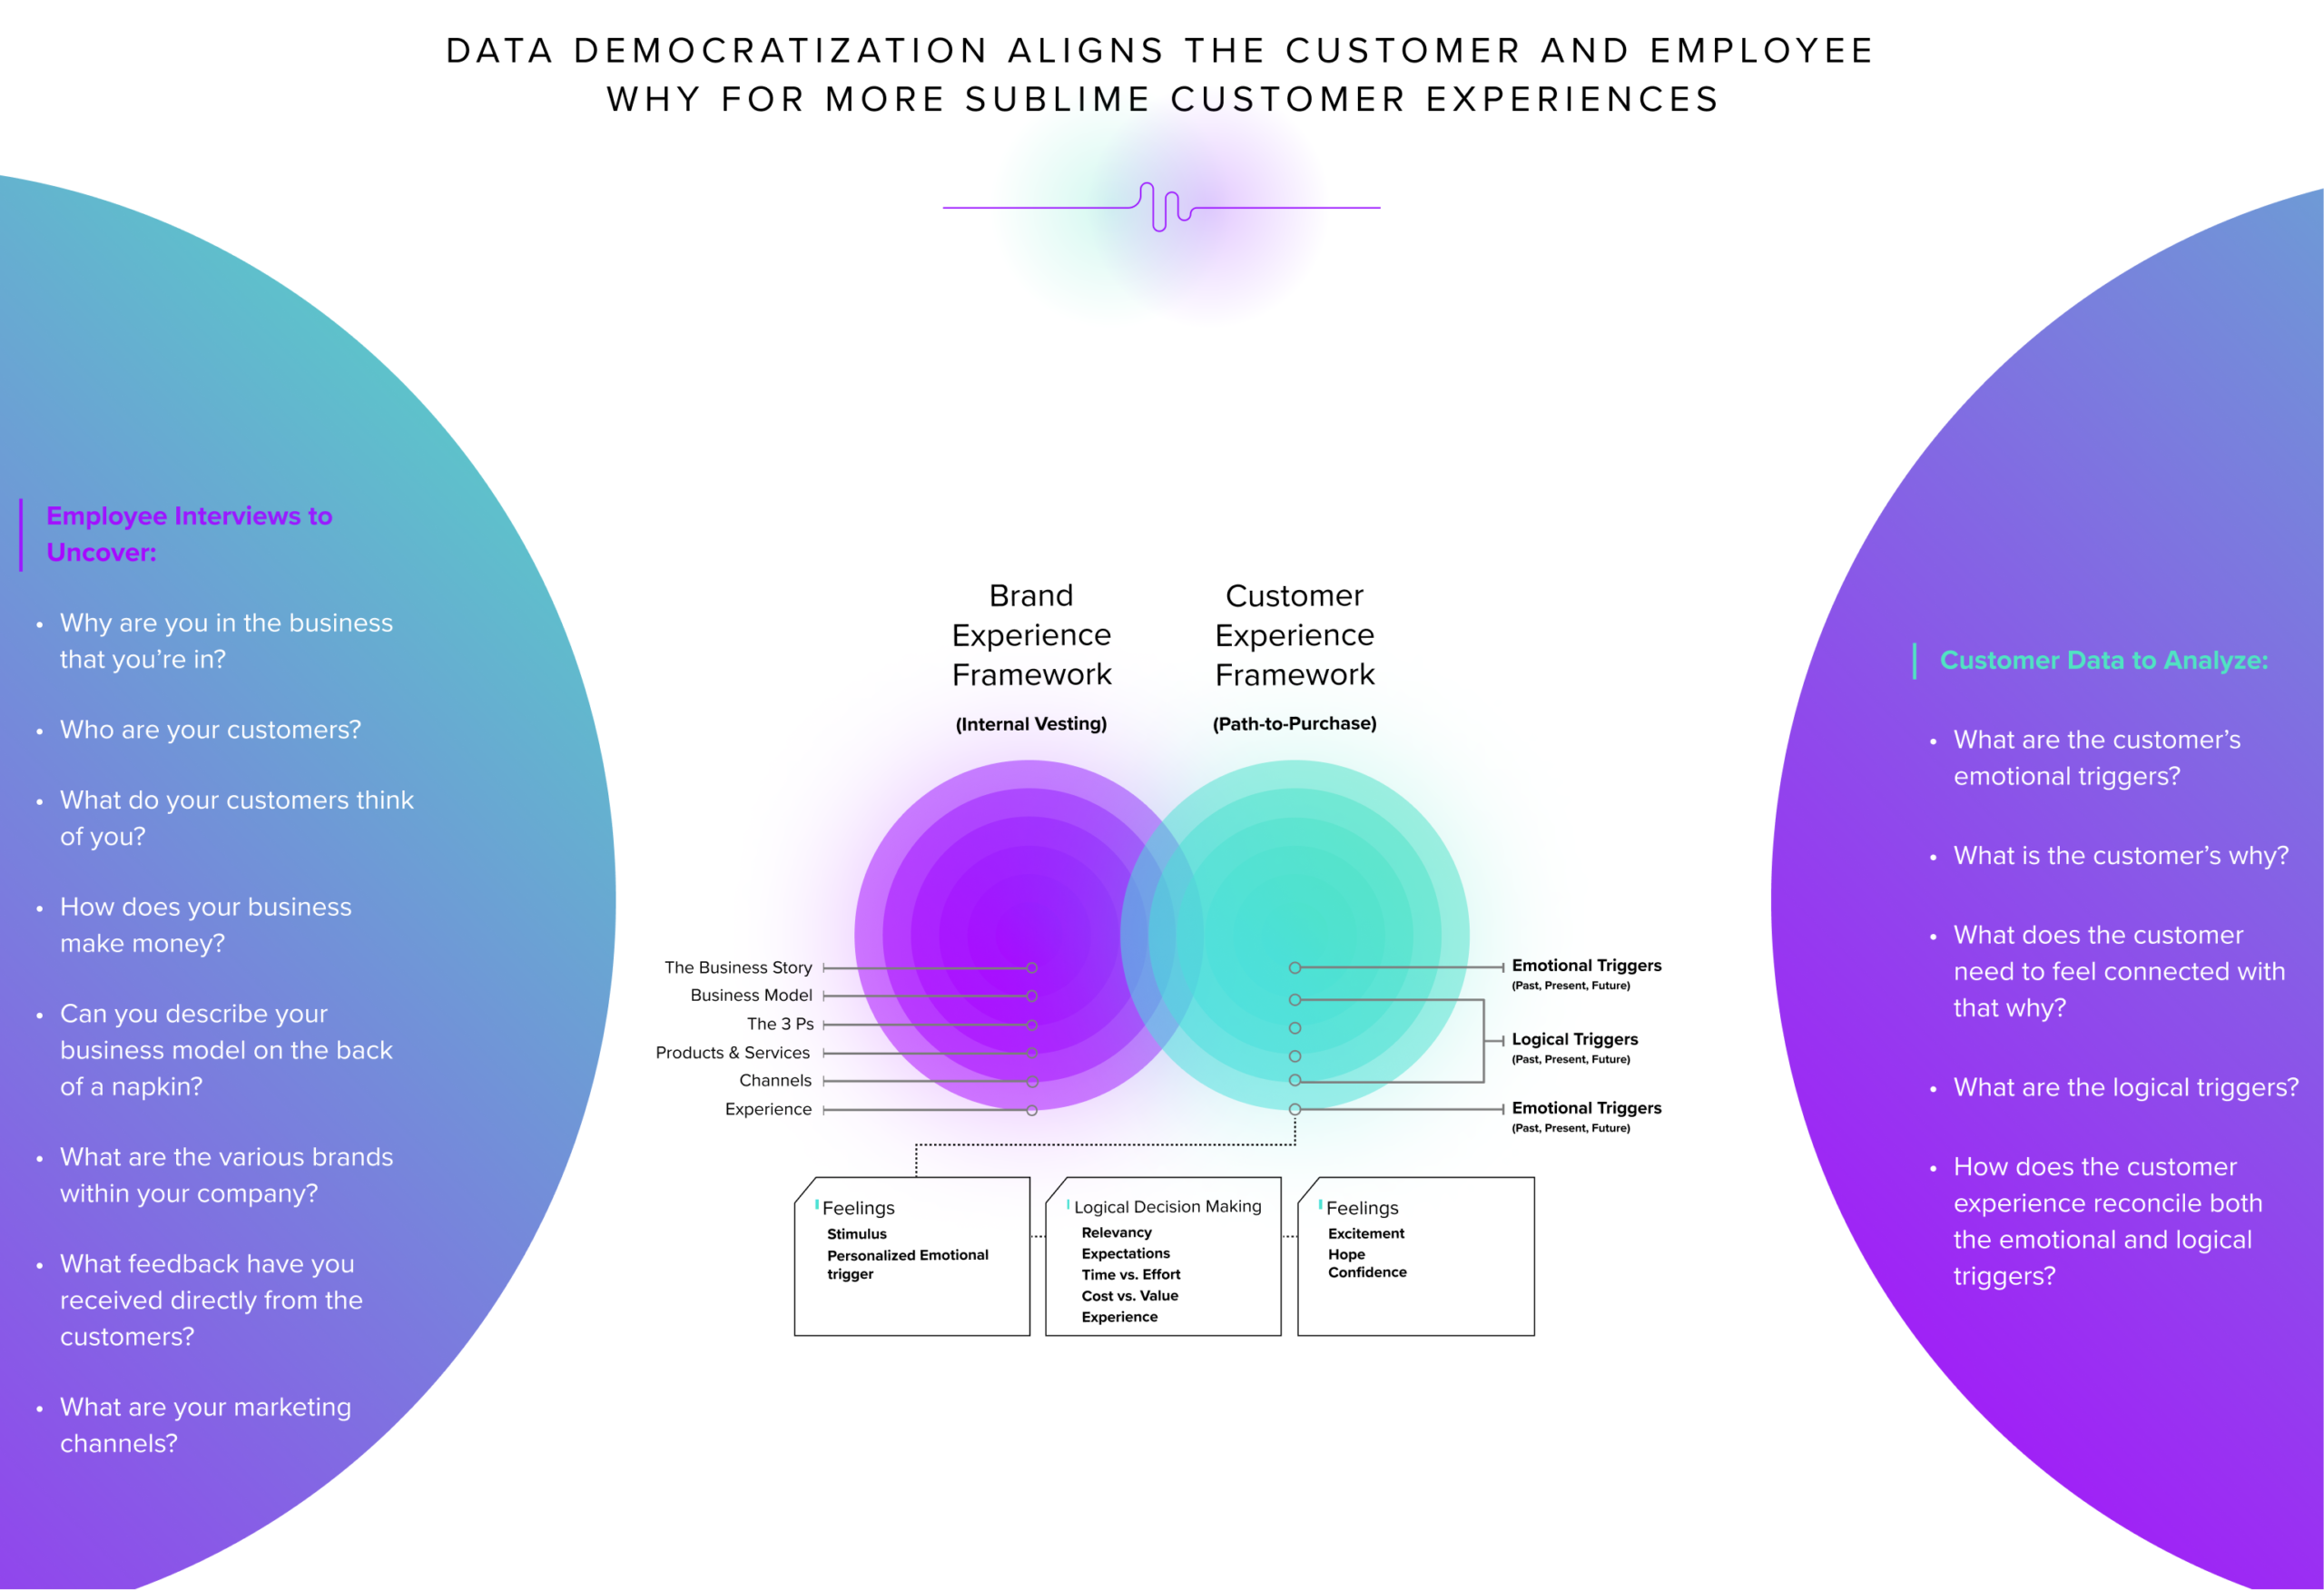
Here are some questions we ask as we kickstart a new project with a client. The questions you see represented here across the employee and customer experience are only a small sampling of what needs to be asked when conducting interviews and research.
When doing this research to understand the customer’s experience and needs better, we first start with employee interviews. During these interviews, we explore questions that cross each layer of the concentric StoryVesting circles. These interviews are important in helping us uncover gaps in internal experiences. Through the conversations, qualitative data collection, and gap analysis, we can quickly identify misalignments, such as the ones mentioned above — silo-based thinking, focus on data over people, and looking at the wrong data. As we dig deeper with the team, it becomes clear how the operations and internal perspectives influence and impact the customer’s experience with the brand.
To paint a picture of what this can look like in practice, let’s unpack how this process works when approaching a website and messaging redesign and why it’s so important. When mapping the story flow on a website, teams often approach the work with a company-first perspective. However, before we design any page or write any copy, our team works to understand what the data tell us by looking at qualitative data. We then unpack the emotional and logical triggers on the customer’s side of the framework and leverage them to design the pages the way we do. It’s that approach that allows us to map the project then more strategically.
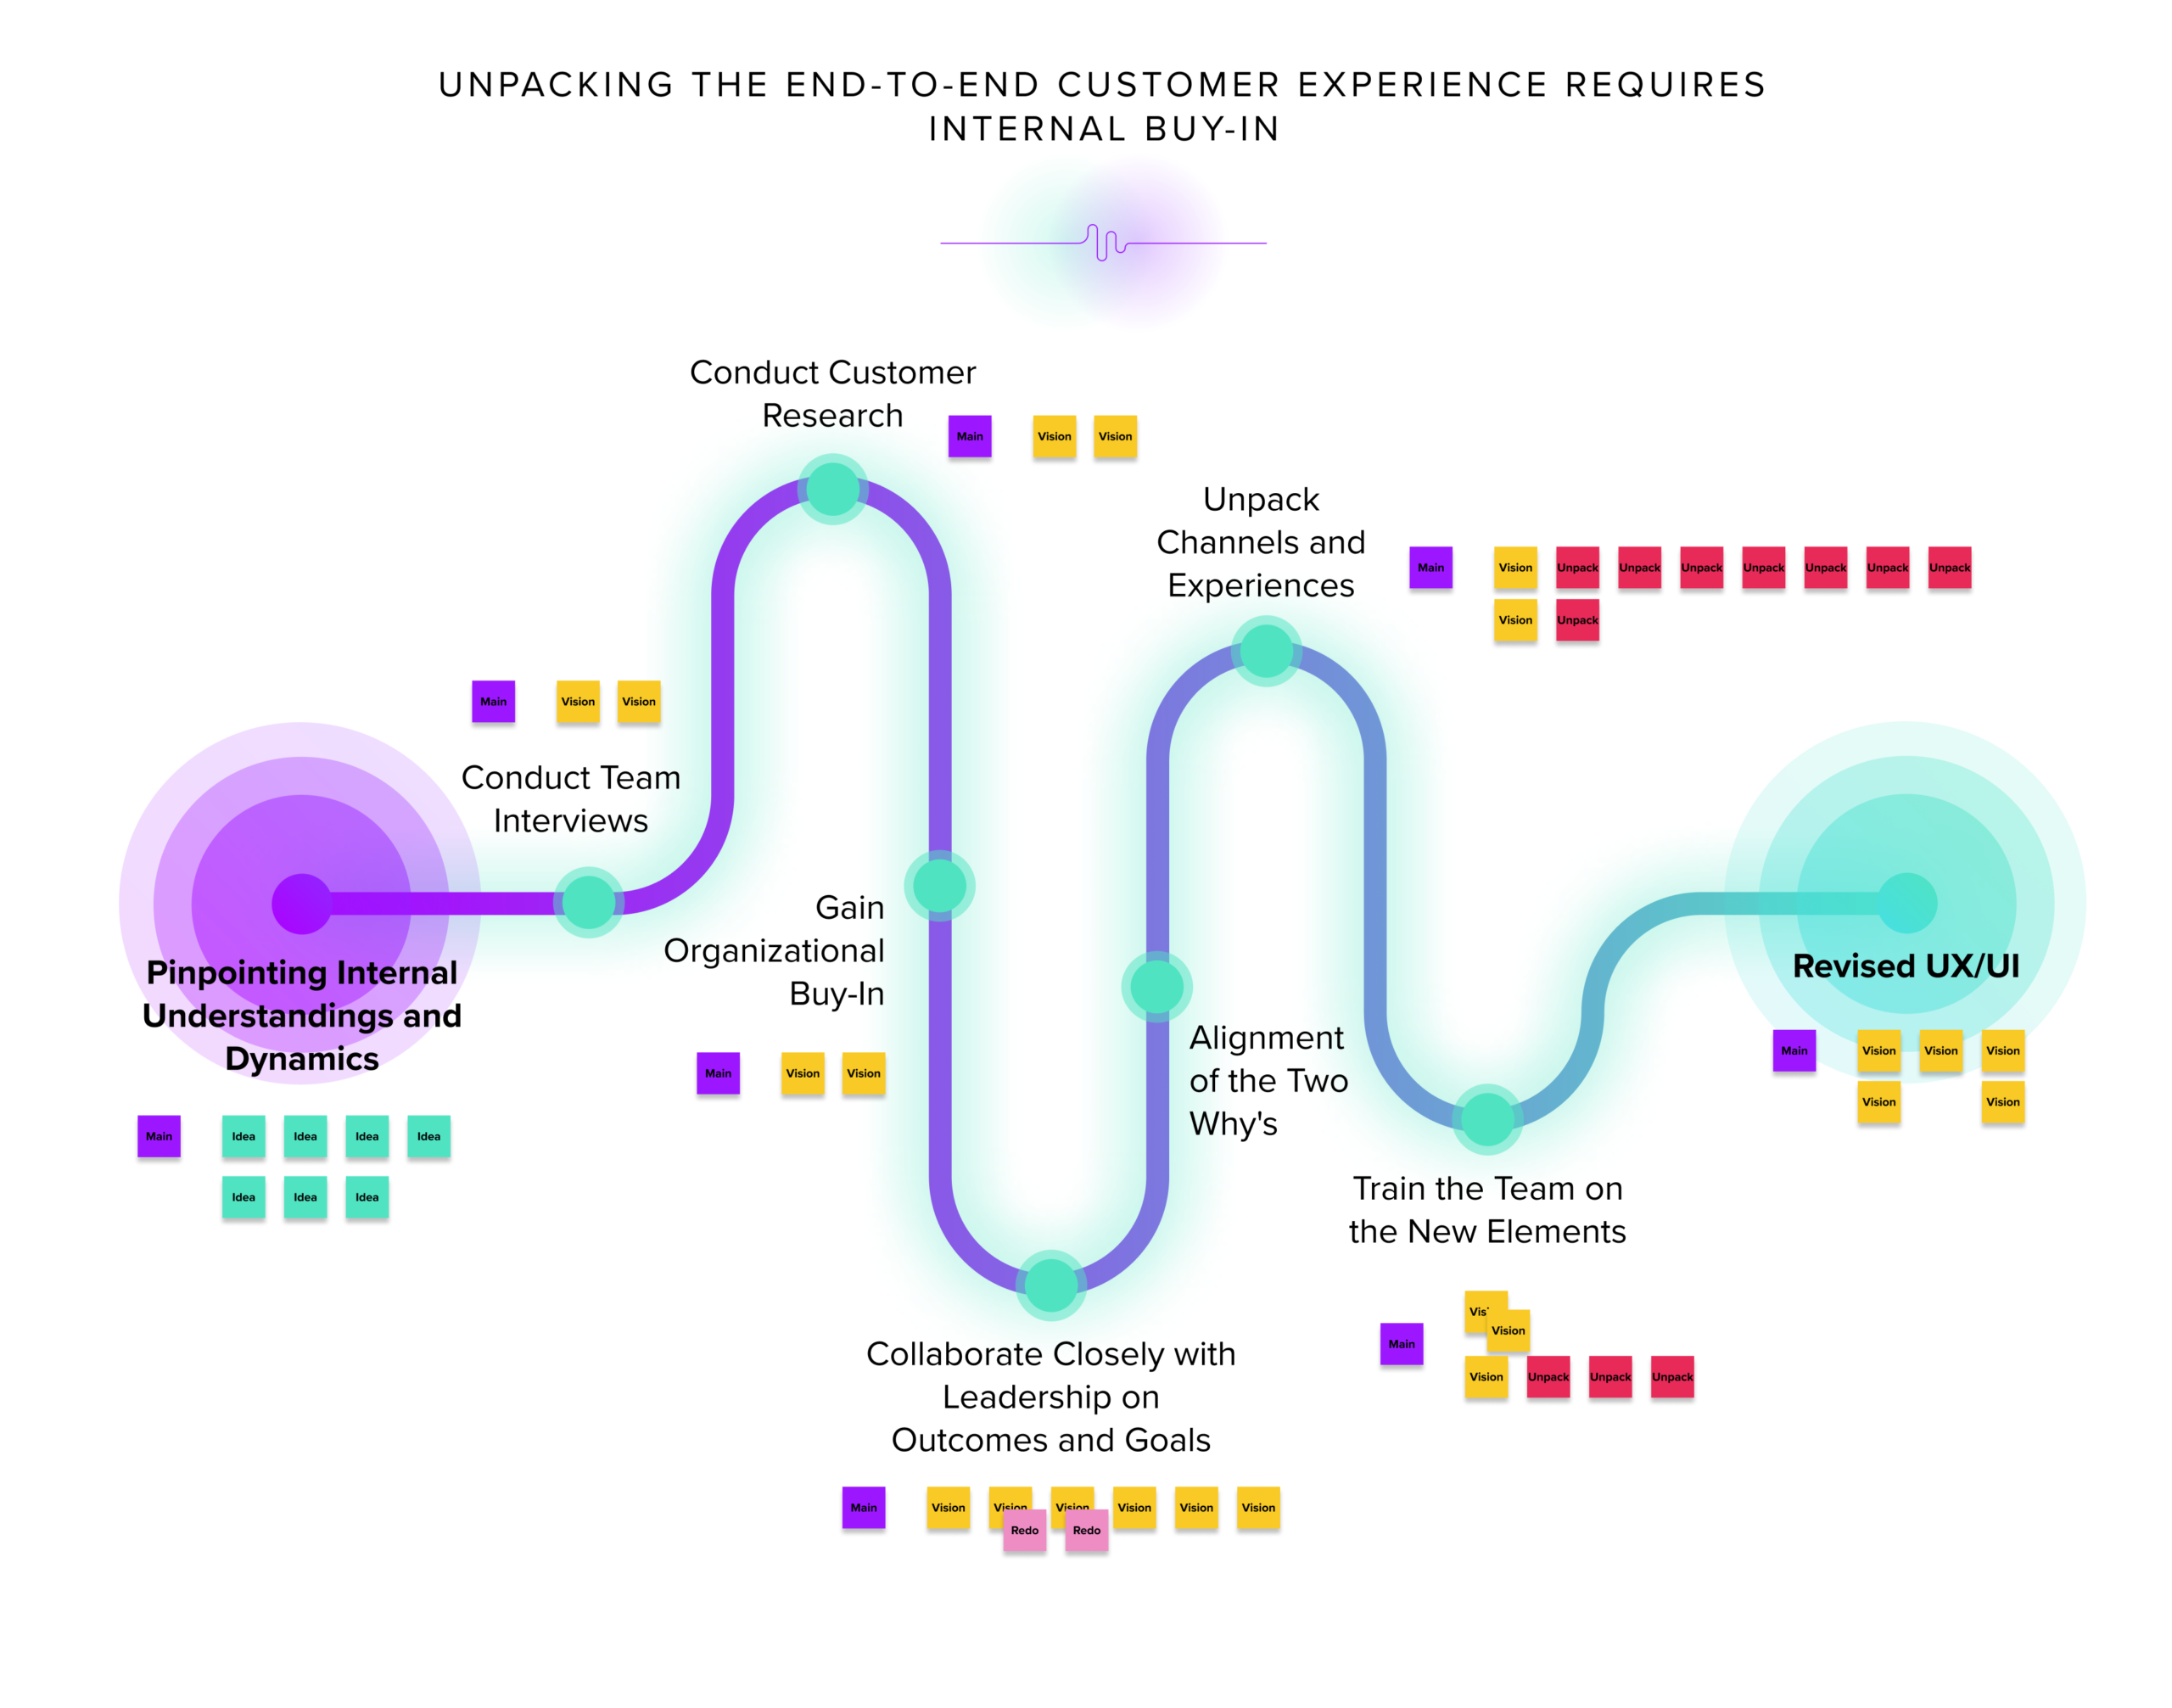
Here is a 40,000-foot overview of how we might approach a new website design. Rather than piecemealing our way through the process, we intentionally align every message, every journey, and every story flows with what the team has heard and what the customers need to hear about converting.
After the employee interviews are completed, and we’ve gathered research and data on the customer journey, our website design and messaging reformation process begins by presenting and training the team on our StoryVesting framework. Equipped with a deeper understanding of our approach, the team can better understand the why behind every single post-it note on our proverbial project board. This understanding is crucial when getting the right answer, compelling UX/UI, and informing a content strategy that drives business outcomes.
With the team on board, we can collaborate closely with leadership and key players to hit major milestones. Along the way, we can validate these checkpoints and ensure the project is aligned across all channels and experiences.
When done, we leave our clients a core template of what was offered, so their internal content team can take the baton and continue running with it. We work hard to get our clients aligned internally, as well as externally, with vendors and customers so that they can better talk the talk and walk the walk. This alignment across various departments and people allows teams to simplify navigating the complexities of building robust customer experiences using overwhelming data. Through that data democratization, everyone can get on board with the big picture of why this matters and stay aligned to the many nuances and movements throughout the project.
Data Democratization Stems From Your Why
For teams to see the big picture, they must understand the organizational why. The problem is humans naturally will lean towards looking at their own why. For example, we’ve found that when display advertisements aren’t working, it’s usually because the copy is company-focused rather than customer-focused.
The same is true of internal operations. When a sales team isn’t performing as well, it is focused more on the commissions than the customer’s needs. Marketers want to cheer hard-to-quantify results during happy hour after work without knowing whether those results made any progress toward the company’s North Star Metric.
It’s crucial that data is democratized to focus on the organization’s why rather than one driven by dopamine and serotonin hits that only fuel specific departments’ needs.
The StoryVesting framework helps teams stay aligned around the organization’s core purpose for being in existence. Likewise, this focus allows leadership to motivate teams toward the same big-picture goal rather than more personal ones. By collectively looking at data that incentivizes retention instead of leads, teams can better understand the people behind the data points.
One organization that failed to focus on the people behind the metrics was Gap. Recently, Gap was called out by TikToker Christopher Clafin, which caused a stir about how the brand uses the social media platform.
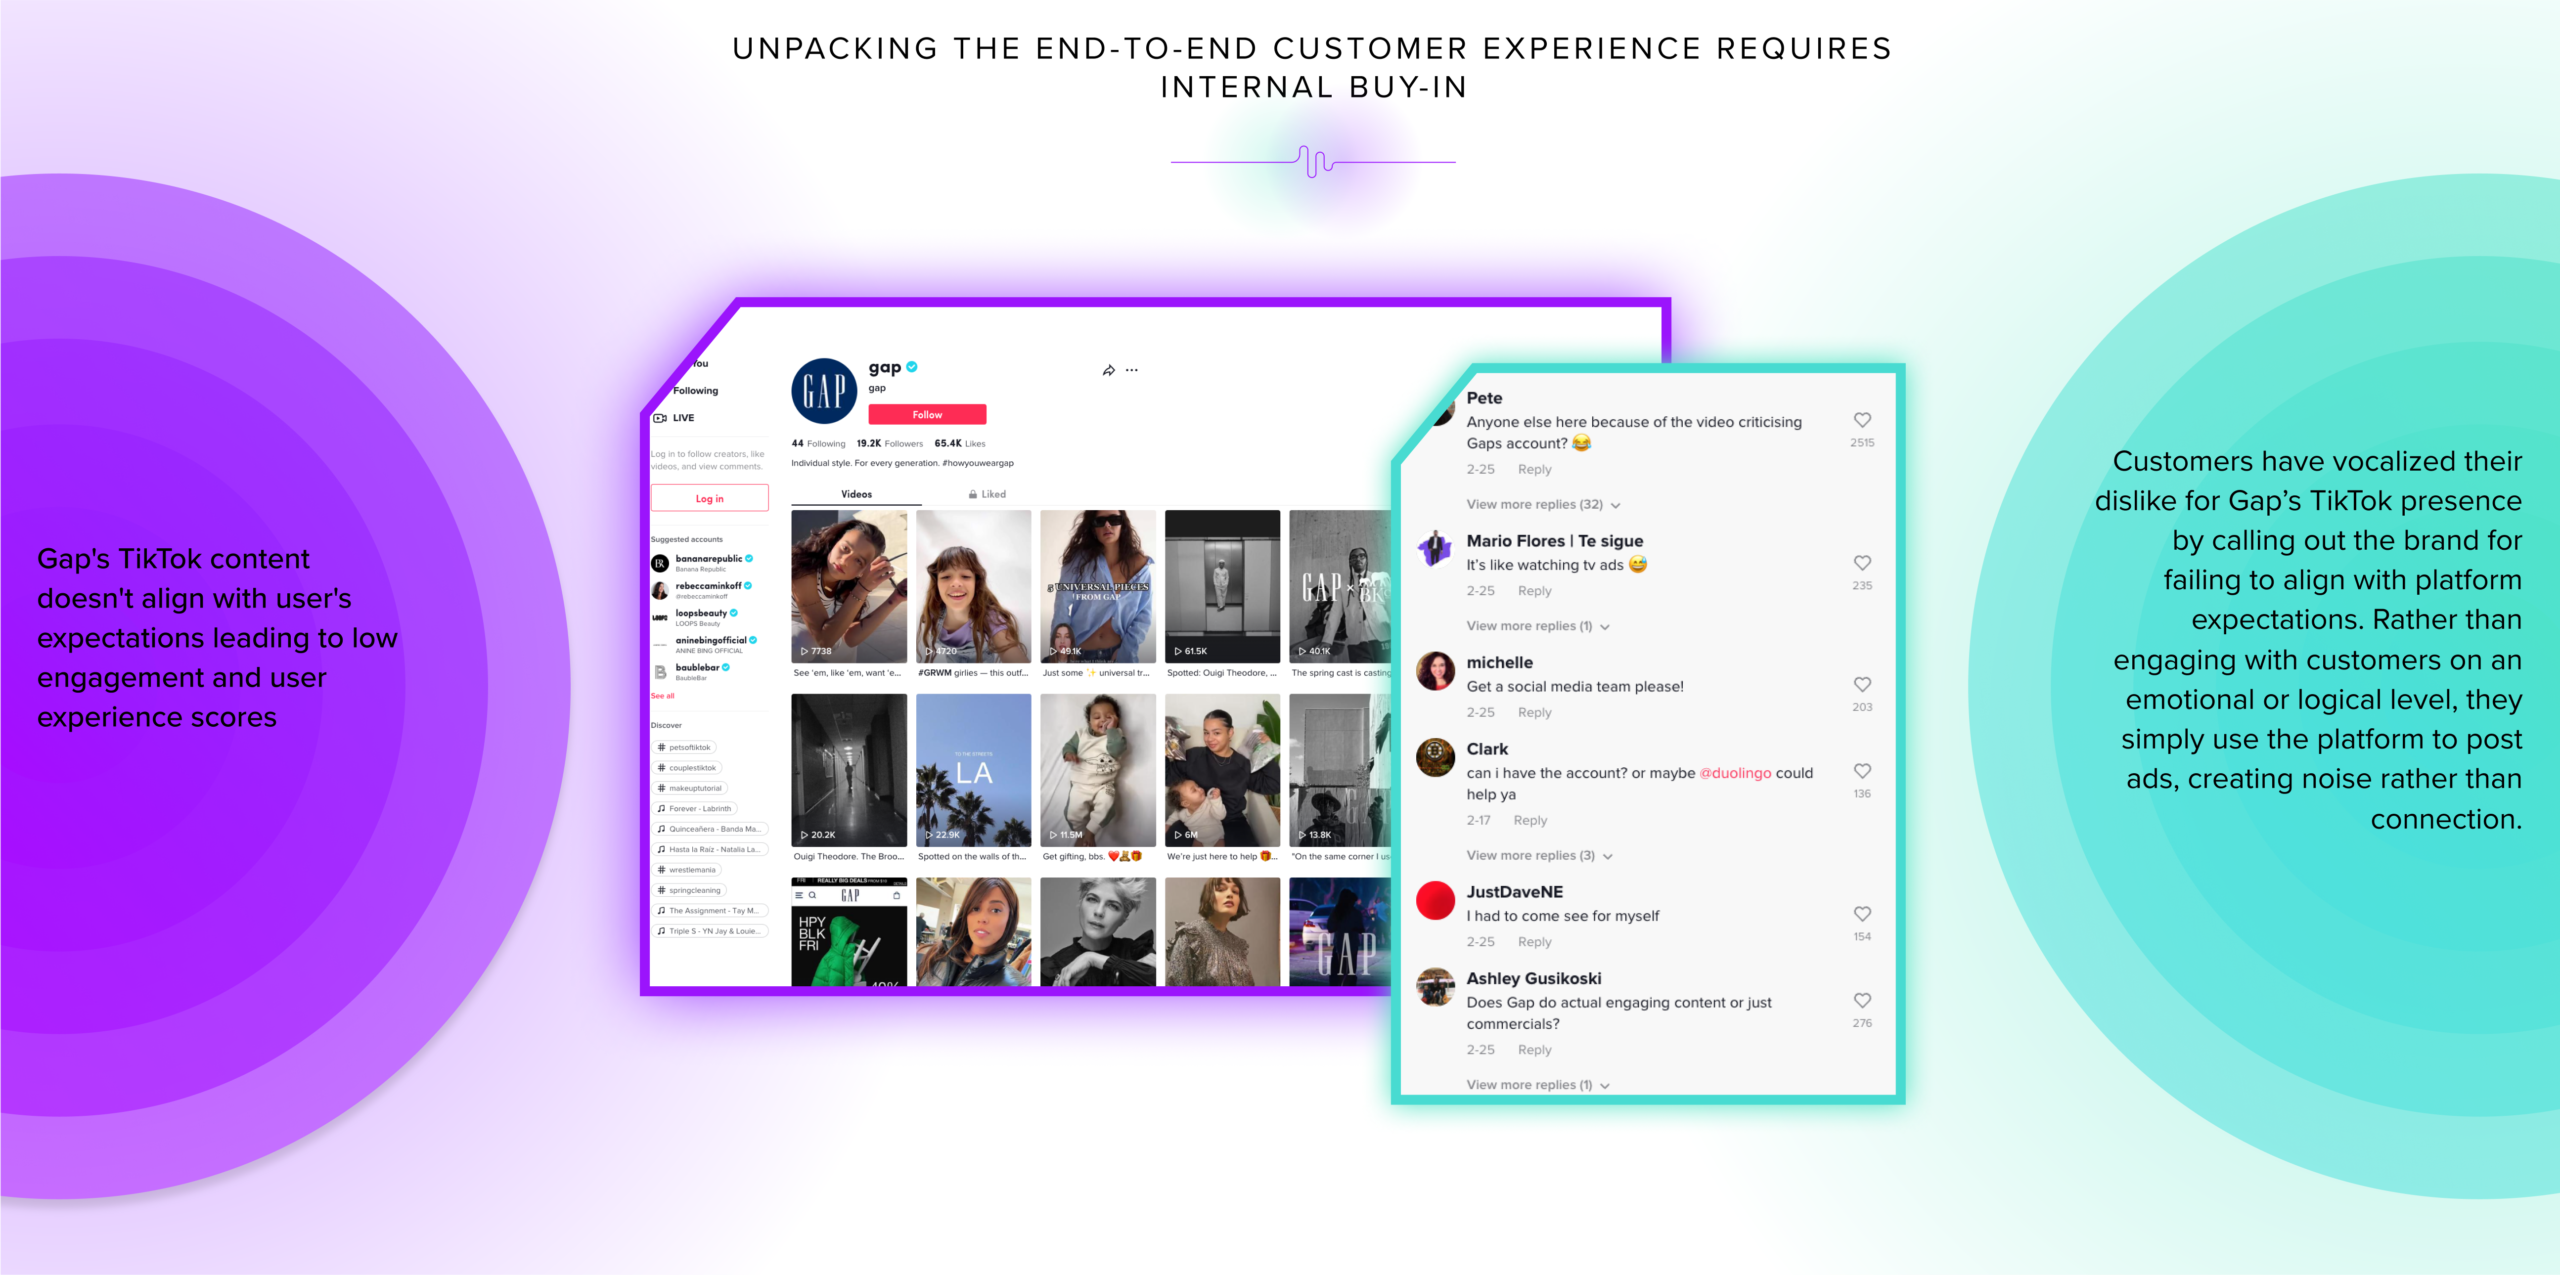
Gap wanted to jump on the Tik Tok bandwagon, so it set up an account and started posting. The problem was whoever was in charge of Gap’s account failed to understand the person on the other side of the screen viewing their posts. Rather than posting what’s expected and desired on the Tik Tok platform, Gap posted corporate stock photos with no personality behind them.
Without having any personality or context around who’s watching, why they’re watching, or how they’re consuming content, brands will have a tough time building engagement and retention among their followers. By rethinking how you approach these platforms as a brand, you can build thought leadership, your brand personality, and something of value. However, if you operate from a black hole by posting for the sake of posting, it can make it nearly impossible to gather the feedback you need to keep moving forward.
Using Data Democratization to Build Retention
Talking about the organizational why has become trendy in recent years, and for good reason. This concept goes well beyond a surface-level approach to business. In focusing on the company’s why, organizations improve retention rates and build more loyalty among their team. Data democratization efforts help keep the company focused on how well the team’s work is moving the needle toward those big-picture goals, thus improving retention efforts. Here’s why.
It’s human nature to want to feel like you’re making an impact. When your team members can see their impact with their work, they inherently feel more valuable. That feeling of being valued as a team player makes a person feel respected in their role, which is critical when it comes to keeping top talent onboard.
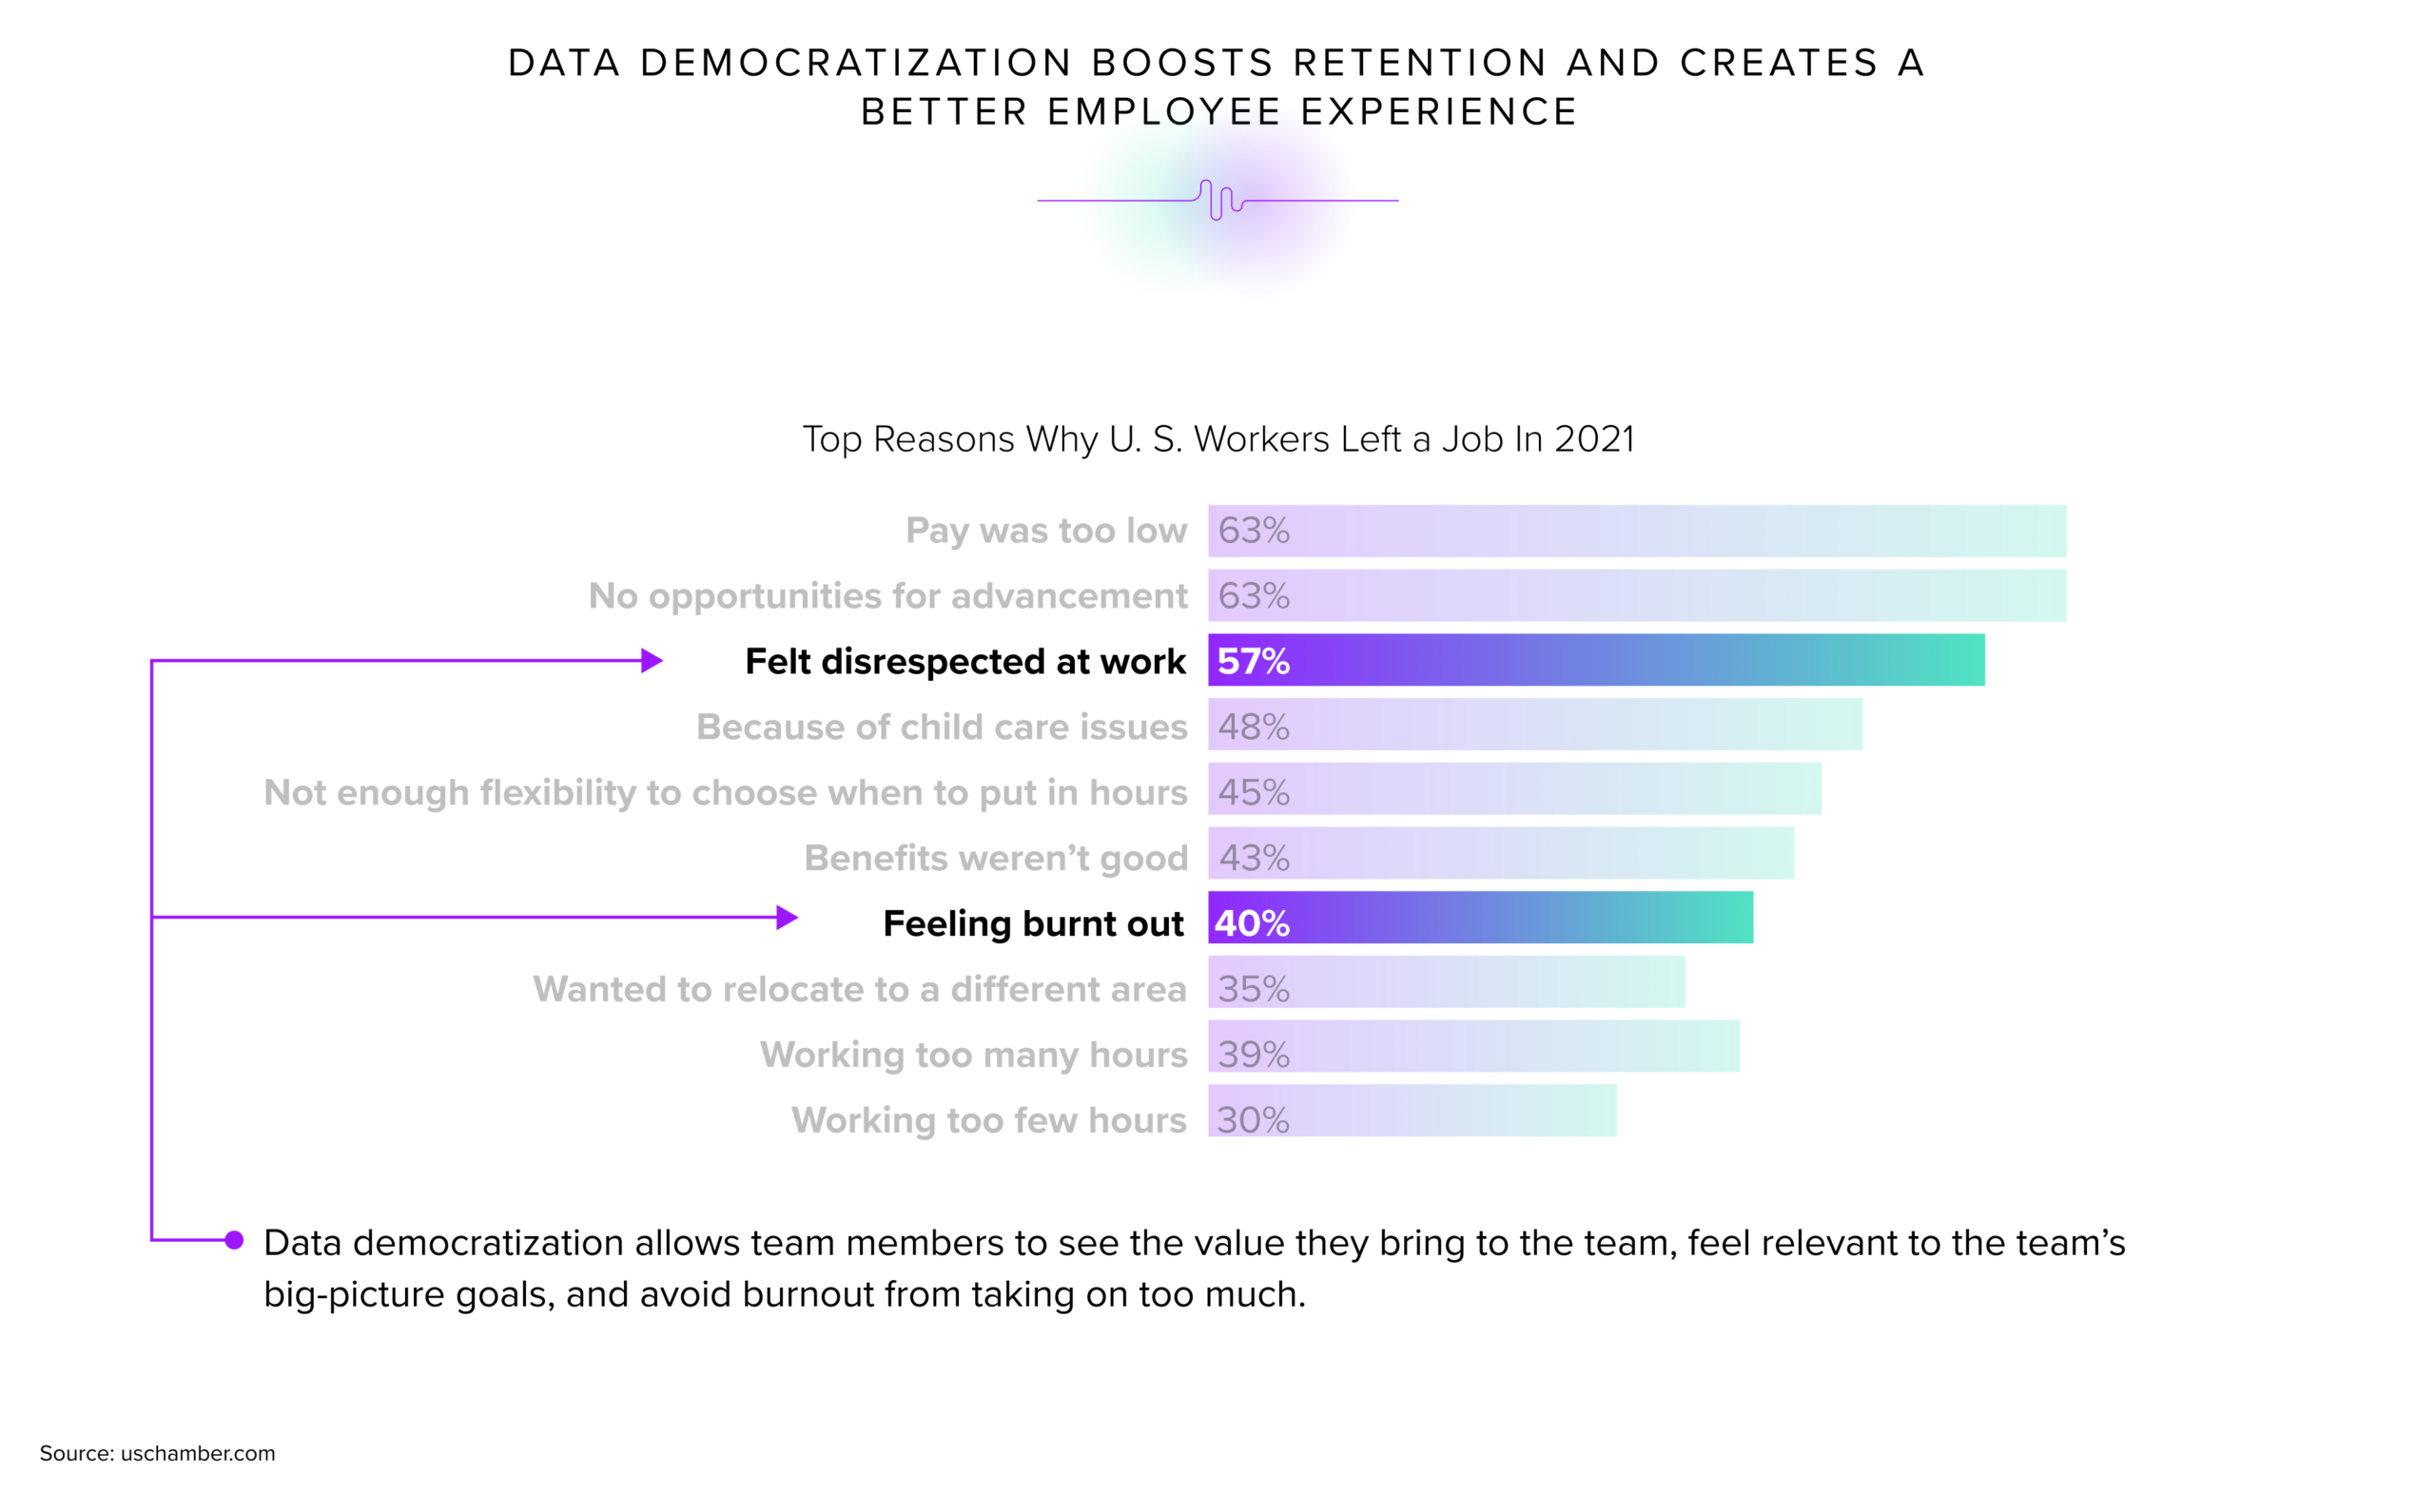
57% of Americans quit their jobs because they felt disrespected. Of those, 35% said it was the major reason they wanted to leave. While those numbers are high and worth considering, the feeling of contributing to the team goes deeper than that too. Feeling valuable can also help avoid burnout among team members.
Team members who feel like they’re on a hamster wheel trying to prove their worth to their colleagues, managers or directors often feel they must go above and beyond in the workplace. Another study by Limeade found that 40% of employees left their job due to burnout. Team members feeling like they have to claw to get ahead and keep their job often means that they take on responsibilities outside of their job description and simultaneously hold tight to the job duties within their role to become indispensable. That stronghold approach means they carry too much weight on their shoulders and keep important data and information from fellow team members, all for job security.
This feeling of having to stay relevant in the job market was recently accentuated by the news of recent tech layoffs that caused employees to be worried. The stress of layoffs can have devastating tolls on individuals, including increased odds of suicide two times or more. Moreover, the layoffs don’t really do a whole lot to improve the company’s performance. Stanford Graduate School of Business Professor Jeffrey Pfeffer said:
“Academic studies have shown that time and time again, workplace reductions don’t do much for paring costs. Severance packages cost money, layoffs increase unemployment insurance rates, and cuts reduce workplace morale and productivity as remaining employees wonder, “Could I be fired too?”
There cannot be sublime customer experiences without outstanding employee experiences. The process of building buzzworthy customer experiences starts with the team. When a new team member comes on board, they must be walked through the layers of the StoryVesting framework and learn:
- The backstory and why of the company
- The business model in its simplest form
- How the 3 Ps work together
- How the products/services come together
- The channels where the products/services are sold
- How all of these layers add up to a beautiful customer experience
In showcasing these layers, the team member training the new hires must weave in elements of why those who are in the room make such a difference to the organization’s outcome. It’s up to the employees to deliver an experience, and it’s up to the organization to measure how well they’re brought into that experience. If the team member is passionate and understands the why, they will have a far better shot at delivering an aligned and sublime customer experience.
Employees deliver. Customers receive. With that perspective in mind and proper training under your team’s belt, it’s easier to democratize marketing, sales, and operational data to tell a clearer story about how relevant the organization is in today’s marketplace.
Knowing how the employees think about relevancy allows teams to move together with more harmony, focus and clarity, no matter the macroeconomic backdrop. They’ll become less afraid of their job security by telling the CMO what’s not working and more likely to help the collective teams move together towards Product-Market Fit through in-depth and focused conversations. That collective movement requires aligned teamwork.
It’s Up to Leaders to Align Teams
Alignment is perhaps the most important ingredient for bringing teams out of their silo-based perspectives, operating with empathy, and focusing on the data points that make a difference to the end goal. However, it’s hard to ignore the many instances where teams end up playing politics instead of playing nice. It’s not unheard of for teams to sink each other to make themselves look better.
Not bringing teams together or sharing the same critical data across all departments, such as the profit and loss statements, can keep teams depersonalized from one another. However, when everyone works together towards a common goal and earns bonuses based on profit sharing, there’s a bigger opportunity for everyone to put their hands and heads together to make a real difference. Reaching this goal where teams work cohesively requires an alignment across all of the 3 Ps — people, platforms and processes.
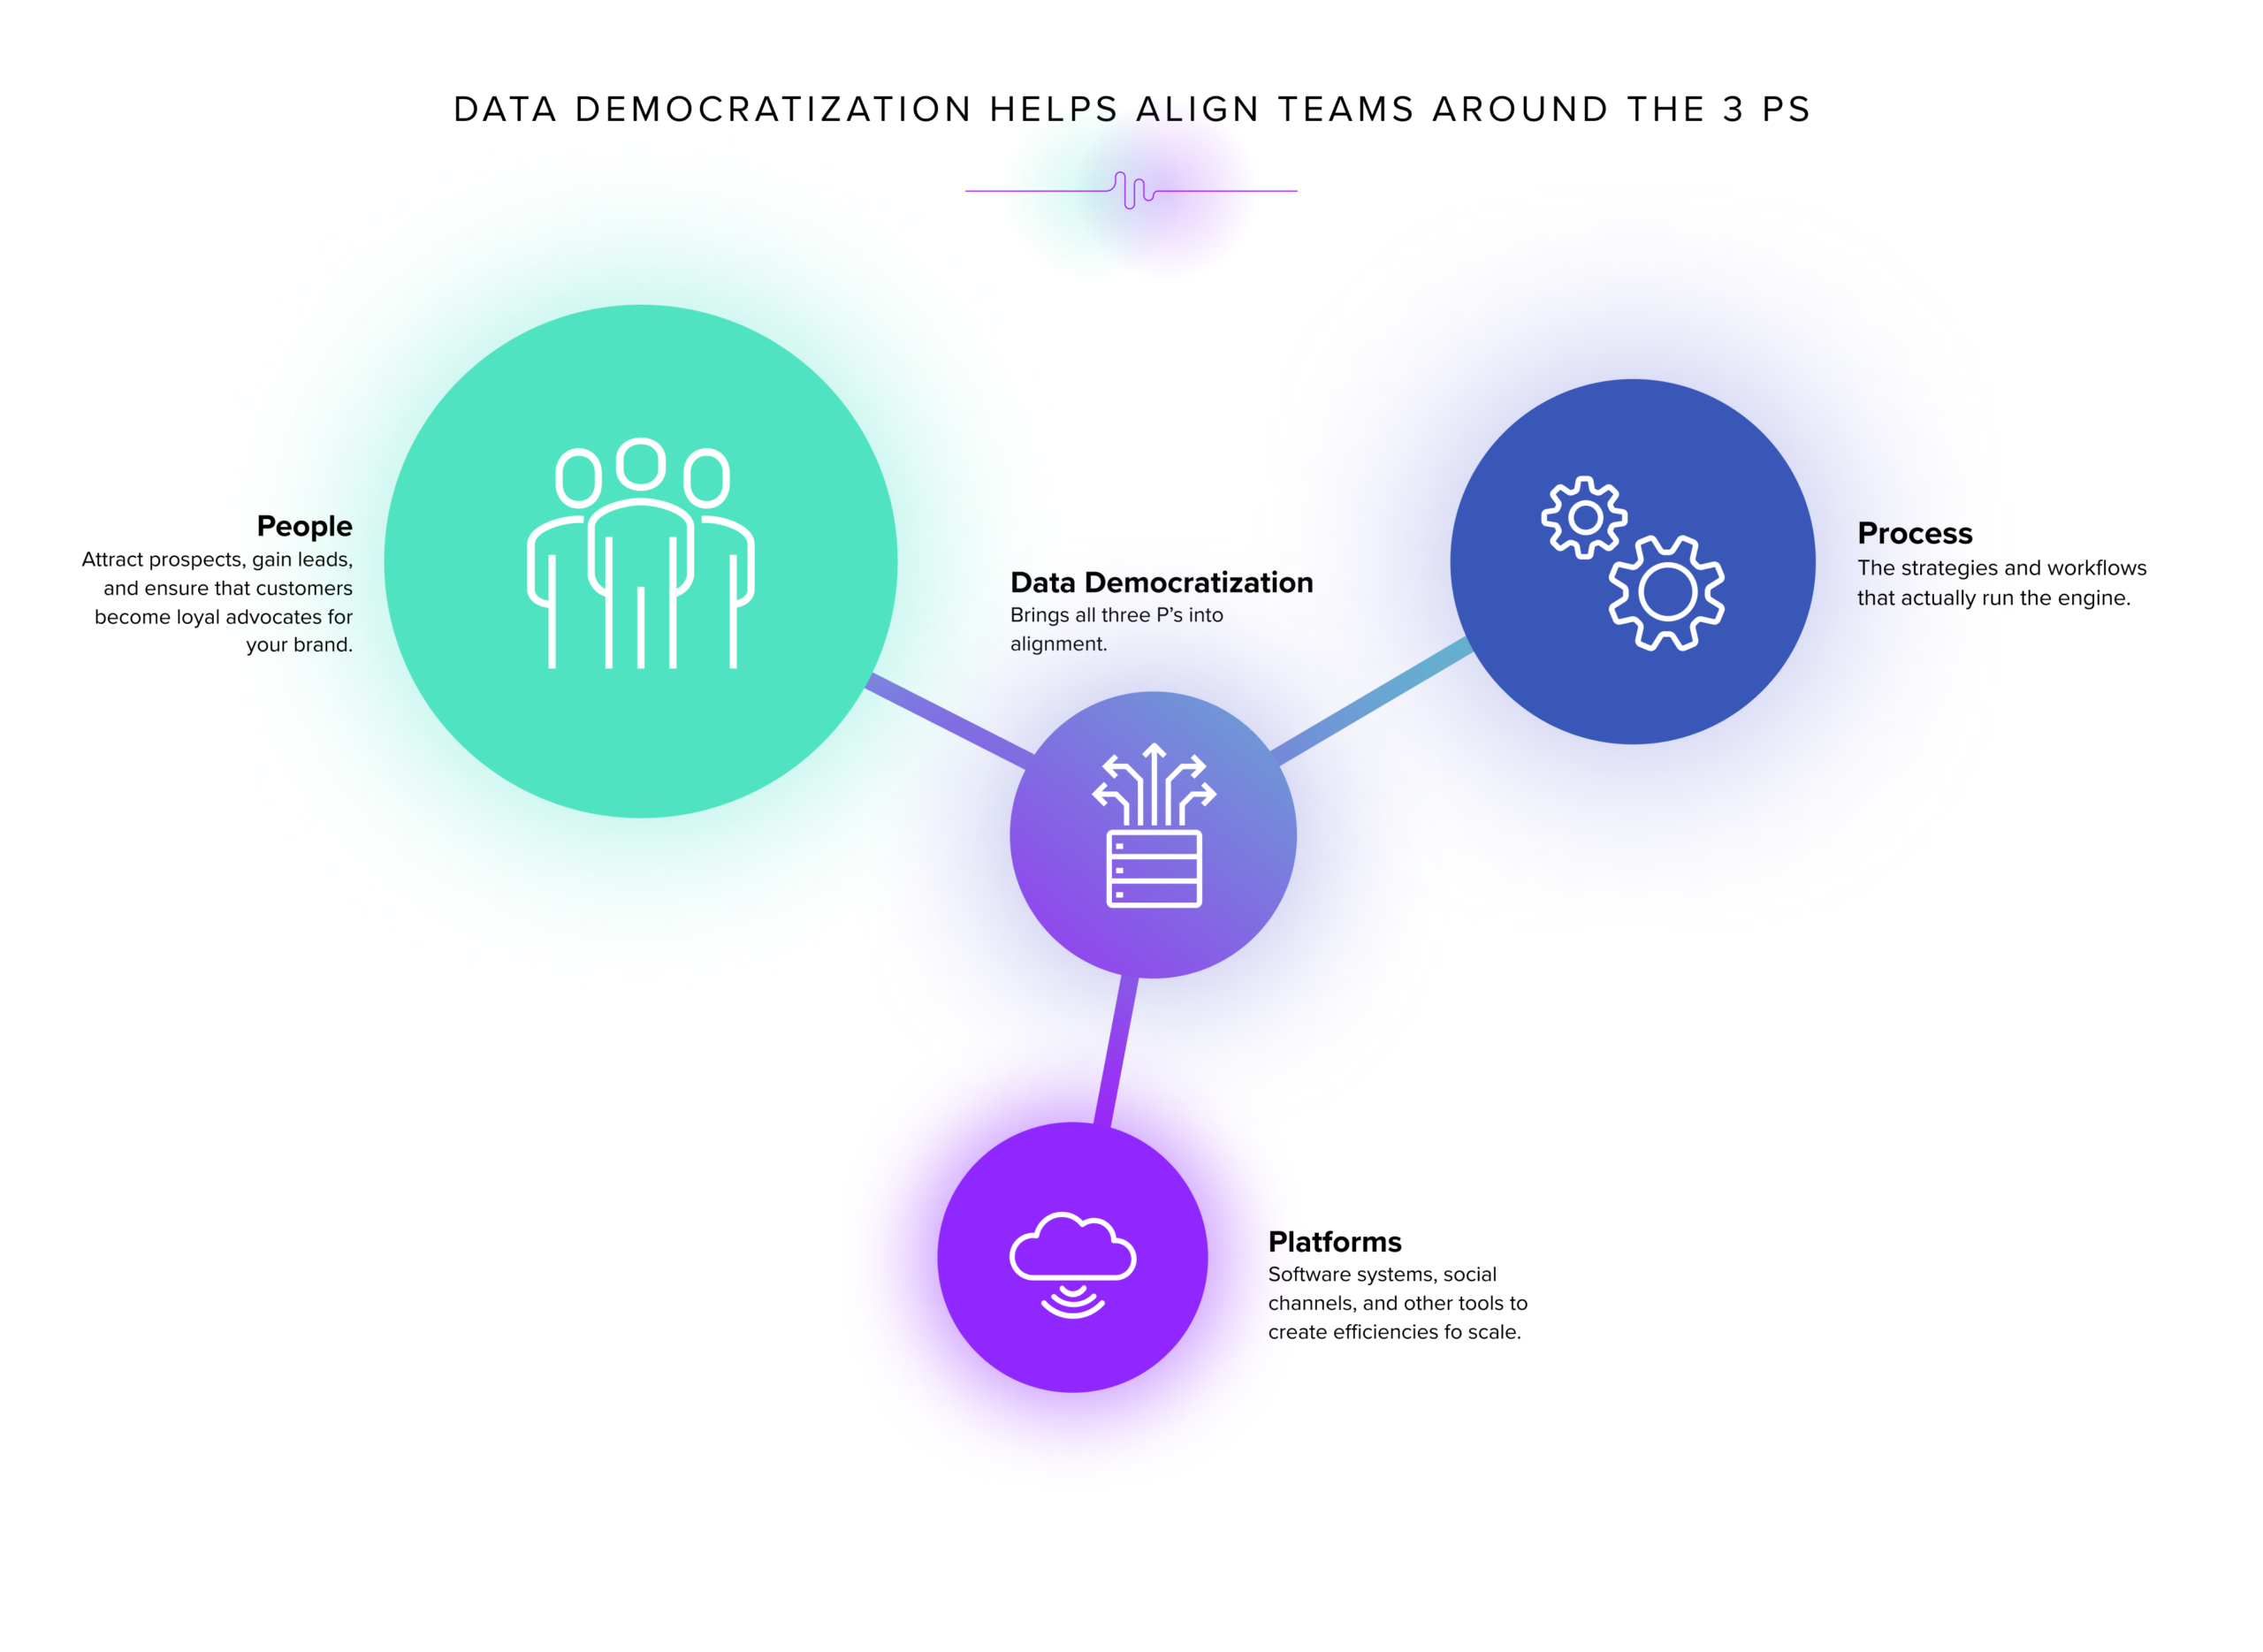
The 3 Ps are critical because this is how you bring your hard work behind the scenes to the forefront for customers. By aligning these three areas, you can build better and stickier experiences. Let’s look at how each element fuses with the other through a data democratization lens.
People
Data and teams should function like a body. Each department works as an organ, pumping lifeblood, nutrients, or fuel to the other areas. Data works as oxygen. The revenues are the bloodstream. Democratizing that data, or oxygen, to reach the various departments is key. Without aligning with that common goals, each team will witness atrophy or systemic shutdown because they’re breathing in the wrong air.
Data democratization allows the employees inside the organization to align behind the same vital signs. Without this data to steer conversations and decision-making, the human tendency is to look for reasons to be upset instead. This human behavior steeped in emotion rather than data causes finger-pointing and blaming, which can lead to other problems mentioned above.
Instead, with data at the helm and a clear understanding of the organization’s why and North Star Metrics, teams can have more thoughtful, provoking, and blameless conversations. These conversations can help bring people together and work toward a common goal.
Platforms
In a few short months, a lot will change regarding where we get data and how we understand it. Specifically, with Universal Analytics sunsetting, many organizations are worried about their next steps. What platforms should you leverage when the tech you’ve used for years doesn’t work? And, when changing the way you measure your data, how do you keep all of those insights clean and measurable?
There are a host of concerns facing organizations today that rely on platforms, such as Google Analytics and cookies, to understand what’s happening in the market.
- Is my tagging compatible?
- Is my site compatible?
- How will I integrate a new analytics platform?
- How will I honor the CCPA cookie consent?
These and other platforms you use are crucial for understanding what’s happening in your business. Without these analytics, it’s much harder to identify critical trends in your company, such as declining year-over-year traffic. But here’s the reality:
Data is personal. There’s a motive behind every data point. And every data point is tied to a sentiment.
Without having access to data points because of the sunsetting of various platforms or the shift in how platforms track customer behavior, the conversations around relevancy and what’s ahead will shift. It’s hard to understand how your business will stand up against a recession or how long you have in your reserves to fuel your business through down economic times. Accessing qualitative and quantitative data sets and then democratizing those data points to the entire organization will keep teams on the same page about what’s happening.
Process
Insights in business don’t just come from people outside of the organization. Nor do they come from the platforms used to gather data about those people’s behaviors. Insights come from some of the most unlikely places. Those unlikely places tend to surface as teams shift how they talk to the end customer to learn more about who’s on the other side of each transaction.
One process we’ve seen companies adopt at scale is deploying marketing surveys. Some organizations send upwards of 15,000 surveys a week in an attempt to get directly to the customer. This falls short when people look at the surveys differently than the organization intended. Typically, surveys offer softer feedback than human interaction. If someone is upset, there’s a different reaction between filling in a Customer Satisfaction (CSAT) score of 1 versus shouting to a listening person on the other side of the phone.
There is not one right or wrong process. It’s about bringing a variety of data sources together, democratizing them across the organization, and then looking for where things line up. In structuring your processes to fuse this data, you inherently reduce the barriers, silos and channels so that teams can better understand what’s happening in the marketplace. This process of collectively distributing information makes it so that teams aren’t playing a game of telephone but rather looking at the same data sets through the same lens.
How We Use Data Democratization to Power Through Growth Challenges
We’re at an inflection point in the market, and nearly every organization we talk to faces some growth challenge going into uncertain territory. When we hear these requests for help getting streamlined, focused and primed for success despite the trepidatious macroeconomic backdrop, we often recommend a growth strategy that stems from democratizing data across all departments.
Whether we’re working with marketing, sales, or customer success teams, everyone must have the insights needed to do their job well and make insights-driven decisions. Turning revenue operations into revenue acceleration is challenging when internal business intelligence and data teams aren’t delivering the insights needed to make those core decisions.
One highly requested way to start the democratization process and get the insights needed is through our proprietary Customer Insights Map. However, a few things must happen before this map can be built correctly and fully leveraged.
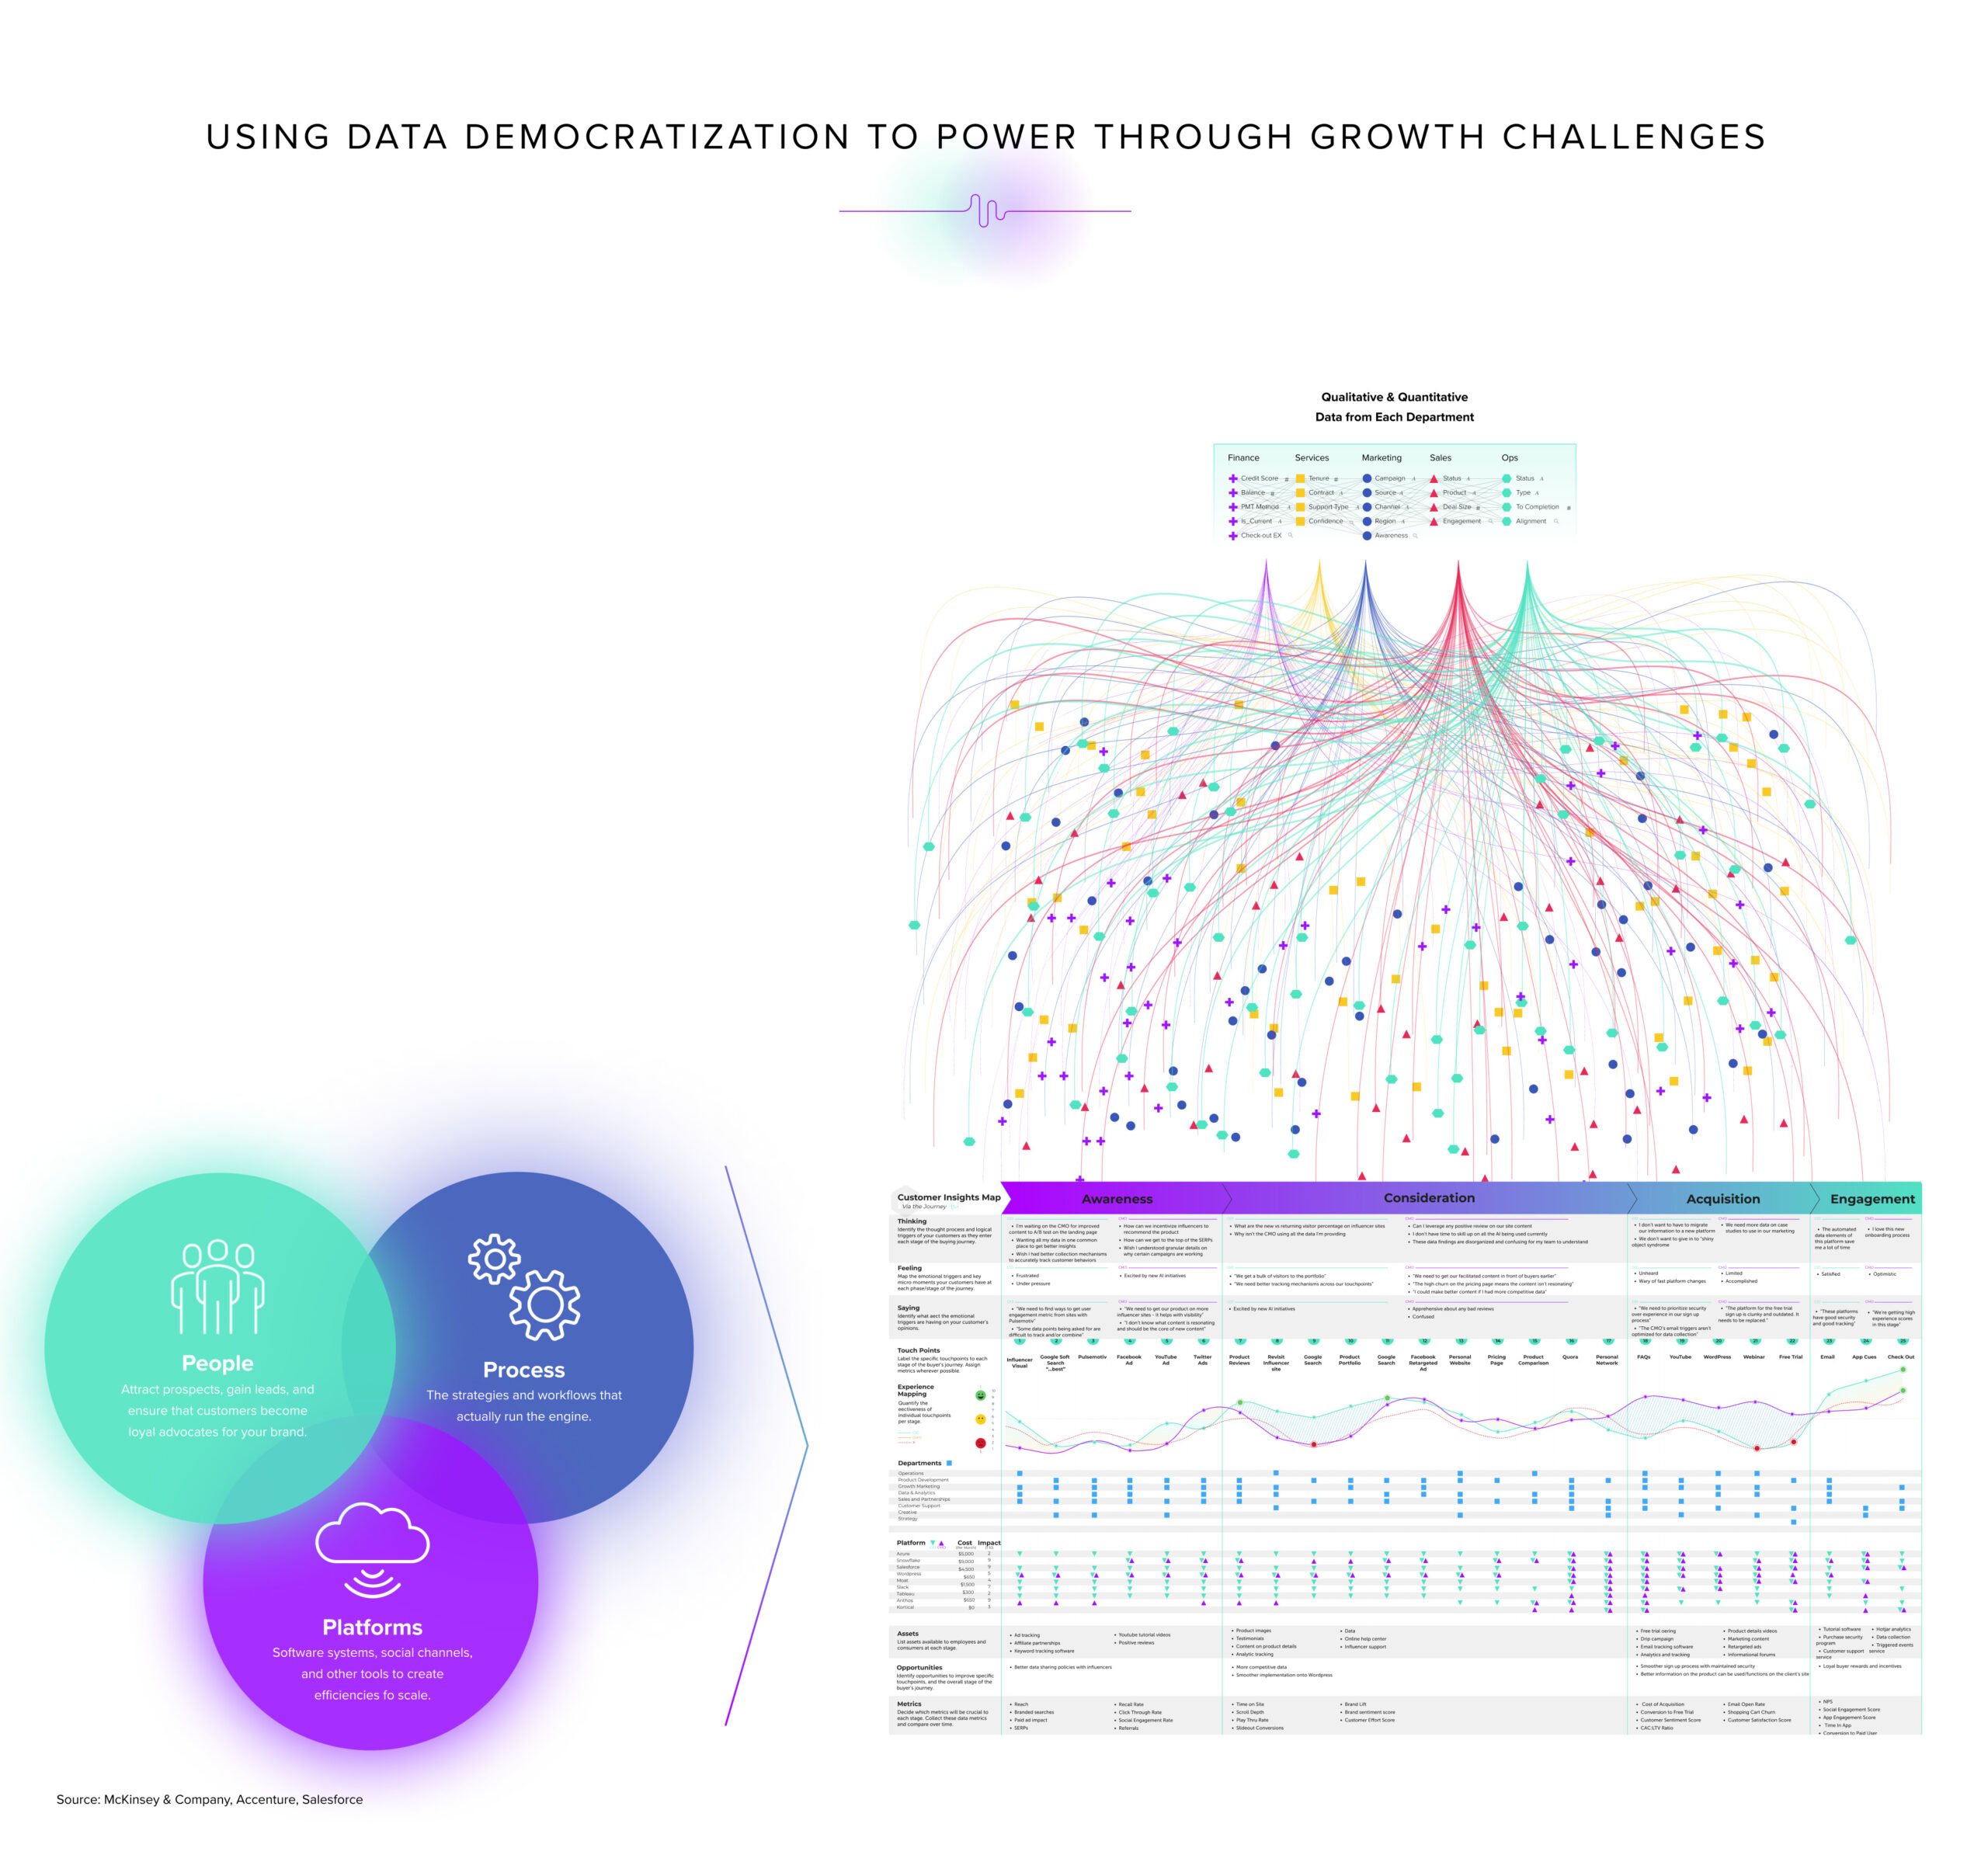
Before any data can be democratized and visualized in this, or any, manner, teams must get the data right. Data must be collected properly, mined, modeled and visualized in a way that allows for proper analysis. Without the right data, people will struggle to get the insights needed to do their job well. Platforms will falter because of incorrect attribution models. And processes will subsequently suffer, causing a rift in customer and employee experiences, because the analysis and understanding is misaligned with what’s actually happening internally and in the market.
Data points must not live in a silo, either. Having insights that extend beyond departments and across the organization allows teams to break out of their limited view and see the ripple effects of their work across the organization as a whole. This approach to broader thinking requires that teams have a centralized place where the data is housed, cleaned and scrubbed. Subsequently, proper data governance is essential in allowing teams to gain this access without tarnishing the quality and accuracy of the data available.
Teams must also look at the right data points and the people behind the data. This perspective is often a struggle because humans want to be the loudest voice in the room to look the best and have job security. That scarcity mindset causes people to stay stuck looking at their own silo, and the tactical nature of the other departments. When teams are just there to make themselves look good, they fail to see the greater vision for the organizational goals. In reality, it’s a cohesive approach that fuels growth. Marketing gets awareness and gathers data points. The sales department then needs those data points to generate more revenues. The service team also needs those data points about the customer to exceed expectations.
For example, whenever we do any Return on Ad Spend (ROAS) optimization, we first ask, “do you have product-market fit?” Typically, marketing departments don’t think about product-market fit mapping as much as they think about building awareness. However, marketing departments need to keep a pulse on continuously improving the product so that the company can stay relevant in the future.
To help aid these efforts, we use a variety of platforms to get a better sense of who we’re reaching to ensure we’re connecting with the right people. This process is becoming increasingly difficult as the targeting methodologies we used five years ago are getting sunsetted. Apple’s Intelligent Tracking Prevention (ITP), a feature in their operating system, has made it even harder by reorienting privacy and data collection.
With the increased fears of data, organizations are having to recoup that data loss. Rather than going without data, organizations have had to enrich their data and align that with what’s available about the customer and their behavioral traits.
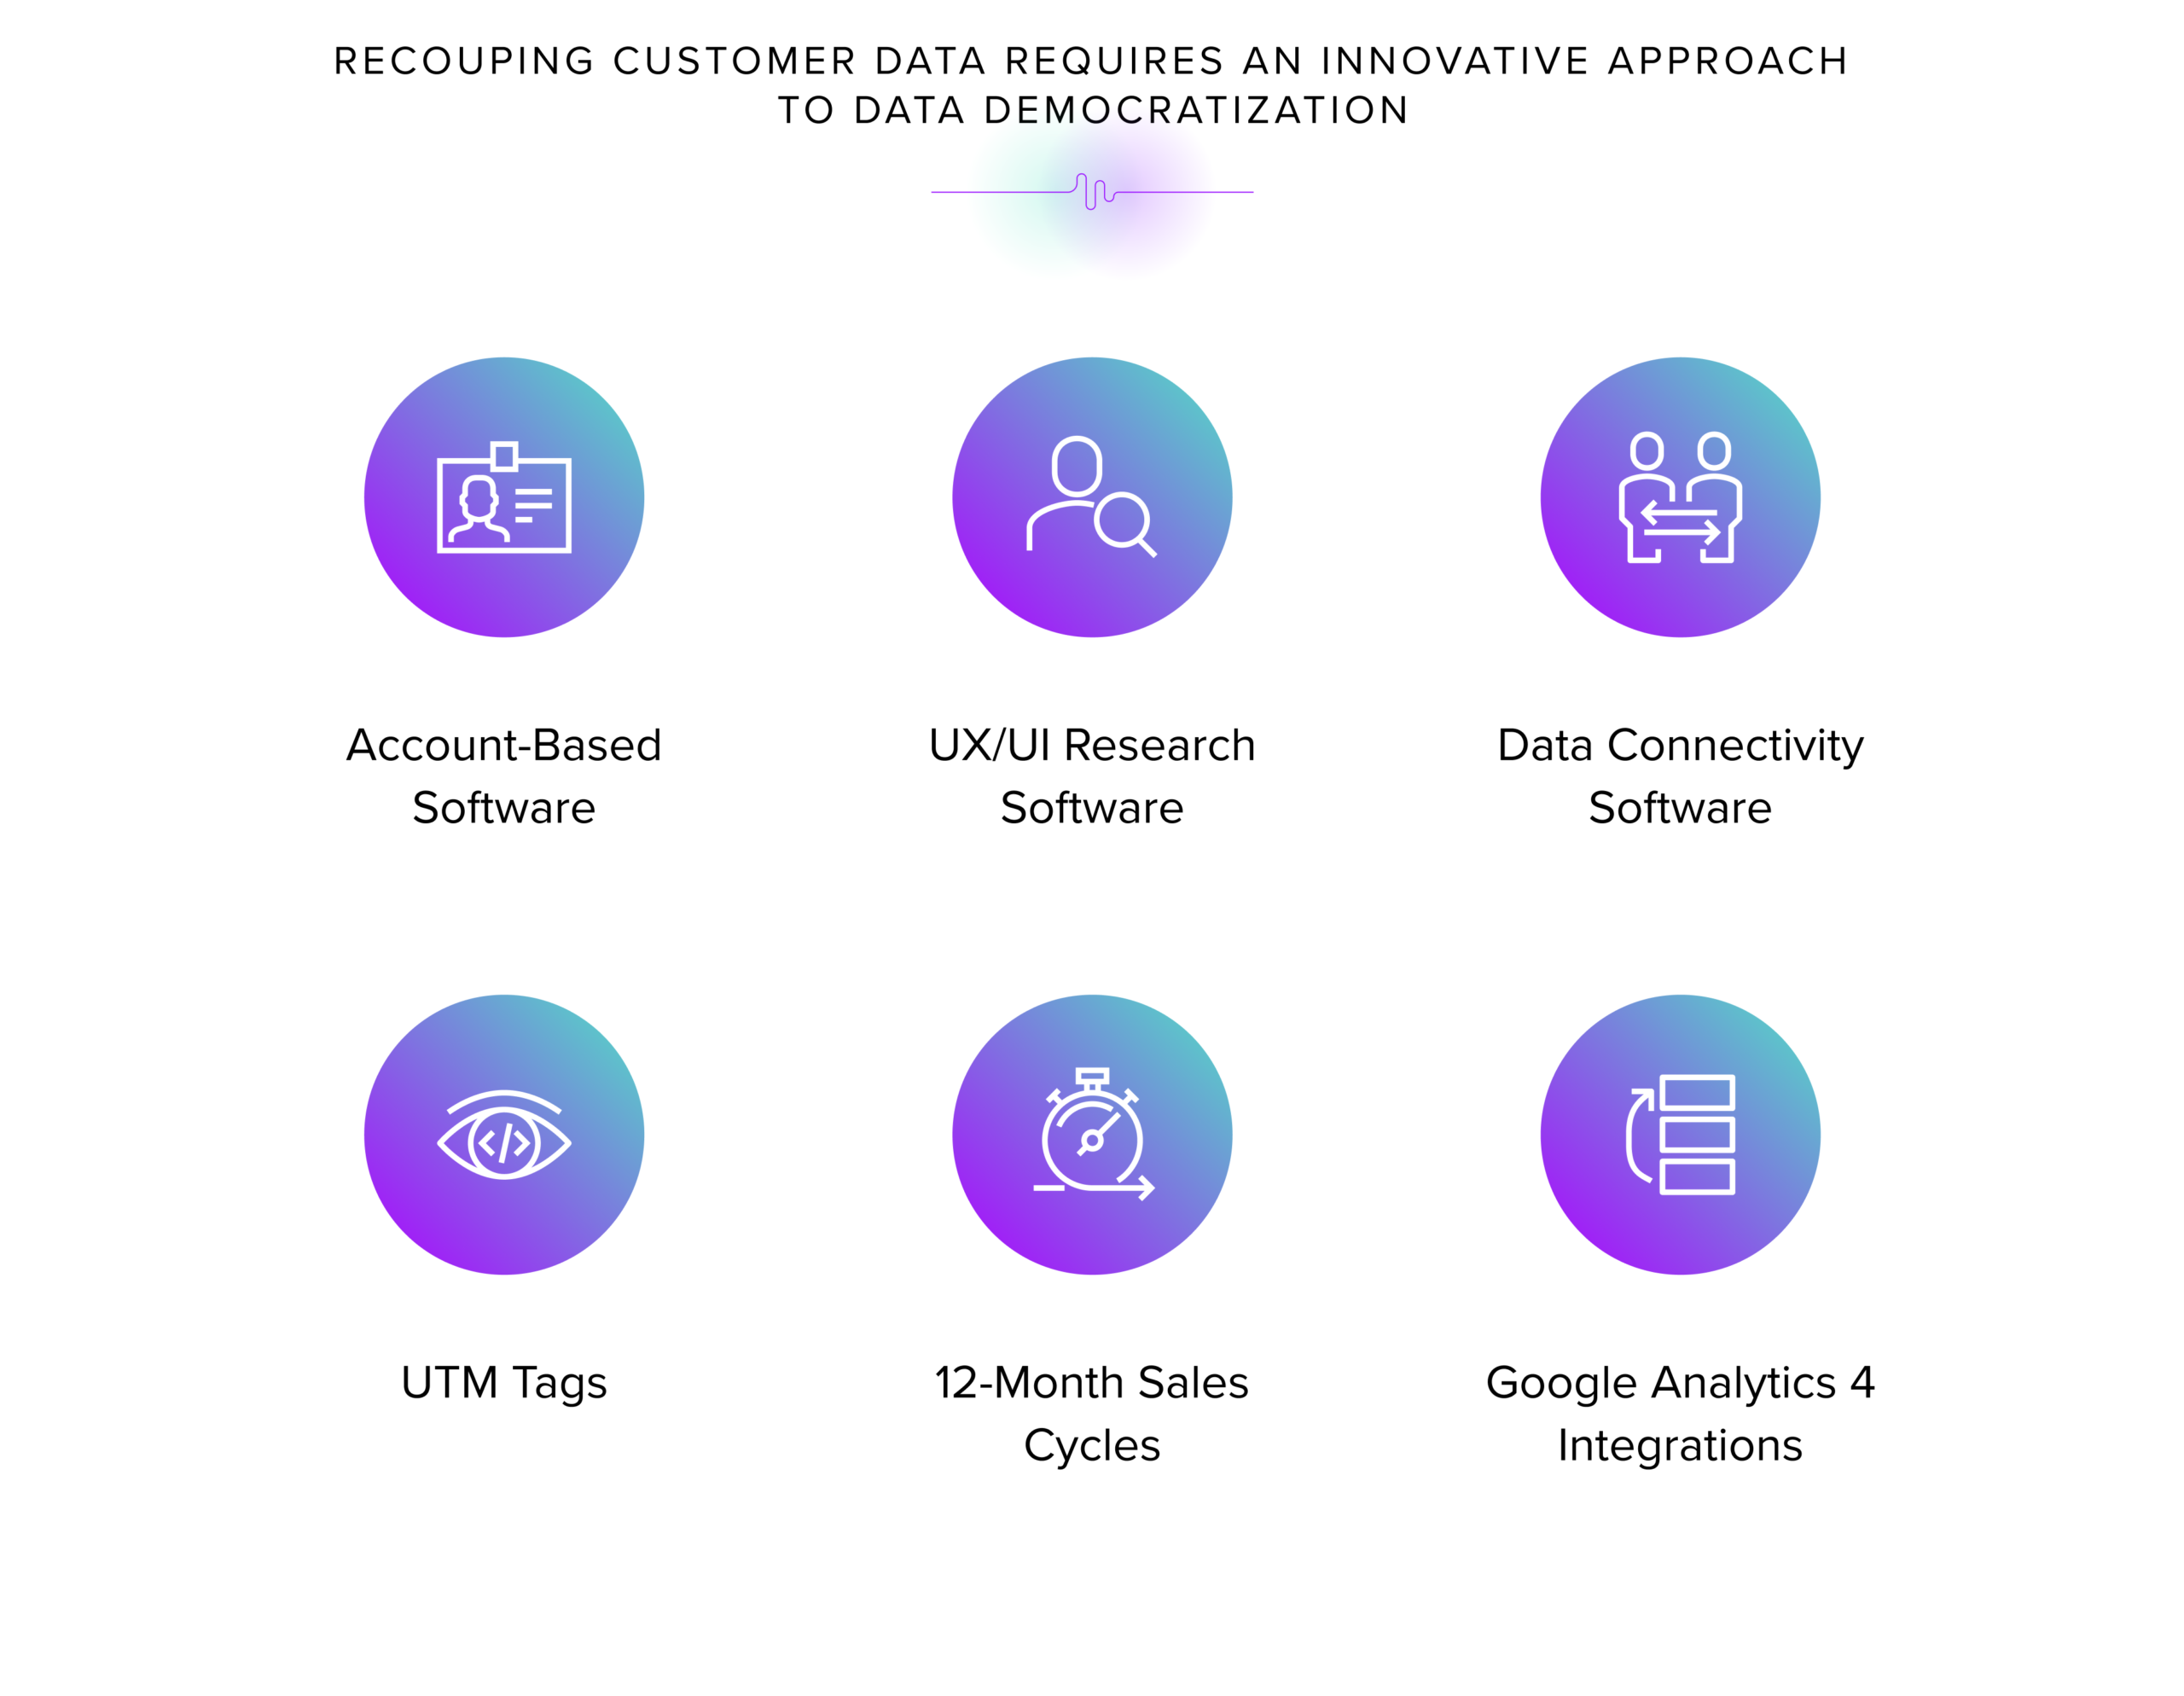
At RocketSource, we’re tech agnostic, which means we don’t recommend specific tools to all of our clients. Instead, we look at what the client needs and the platforms they already use and then recommend which tools to integrate into their tech stack that will have the most minimal disruption of operations. With that said, we like using various tools that let us get behind the scenes and between customers’ ears to gather data, even as data collection becomes harder. Tools like account-based management software, UX/UI research tools and data connectivity software let us get deeper into the trenches without breaking any privacy laws.
With this deeper data and better understanding, organizations can democratize what’s available to all teams and leverage the insights to tackle growth challenges and improve revenue operations. This strategy aims to help you make money and accelerate revenues. To answer how that comes to fruition, we follow a distinct process.
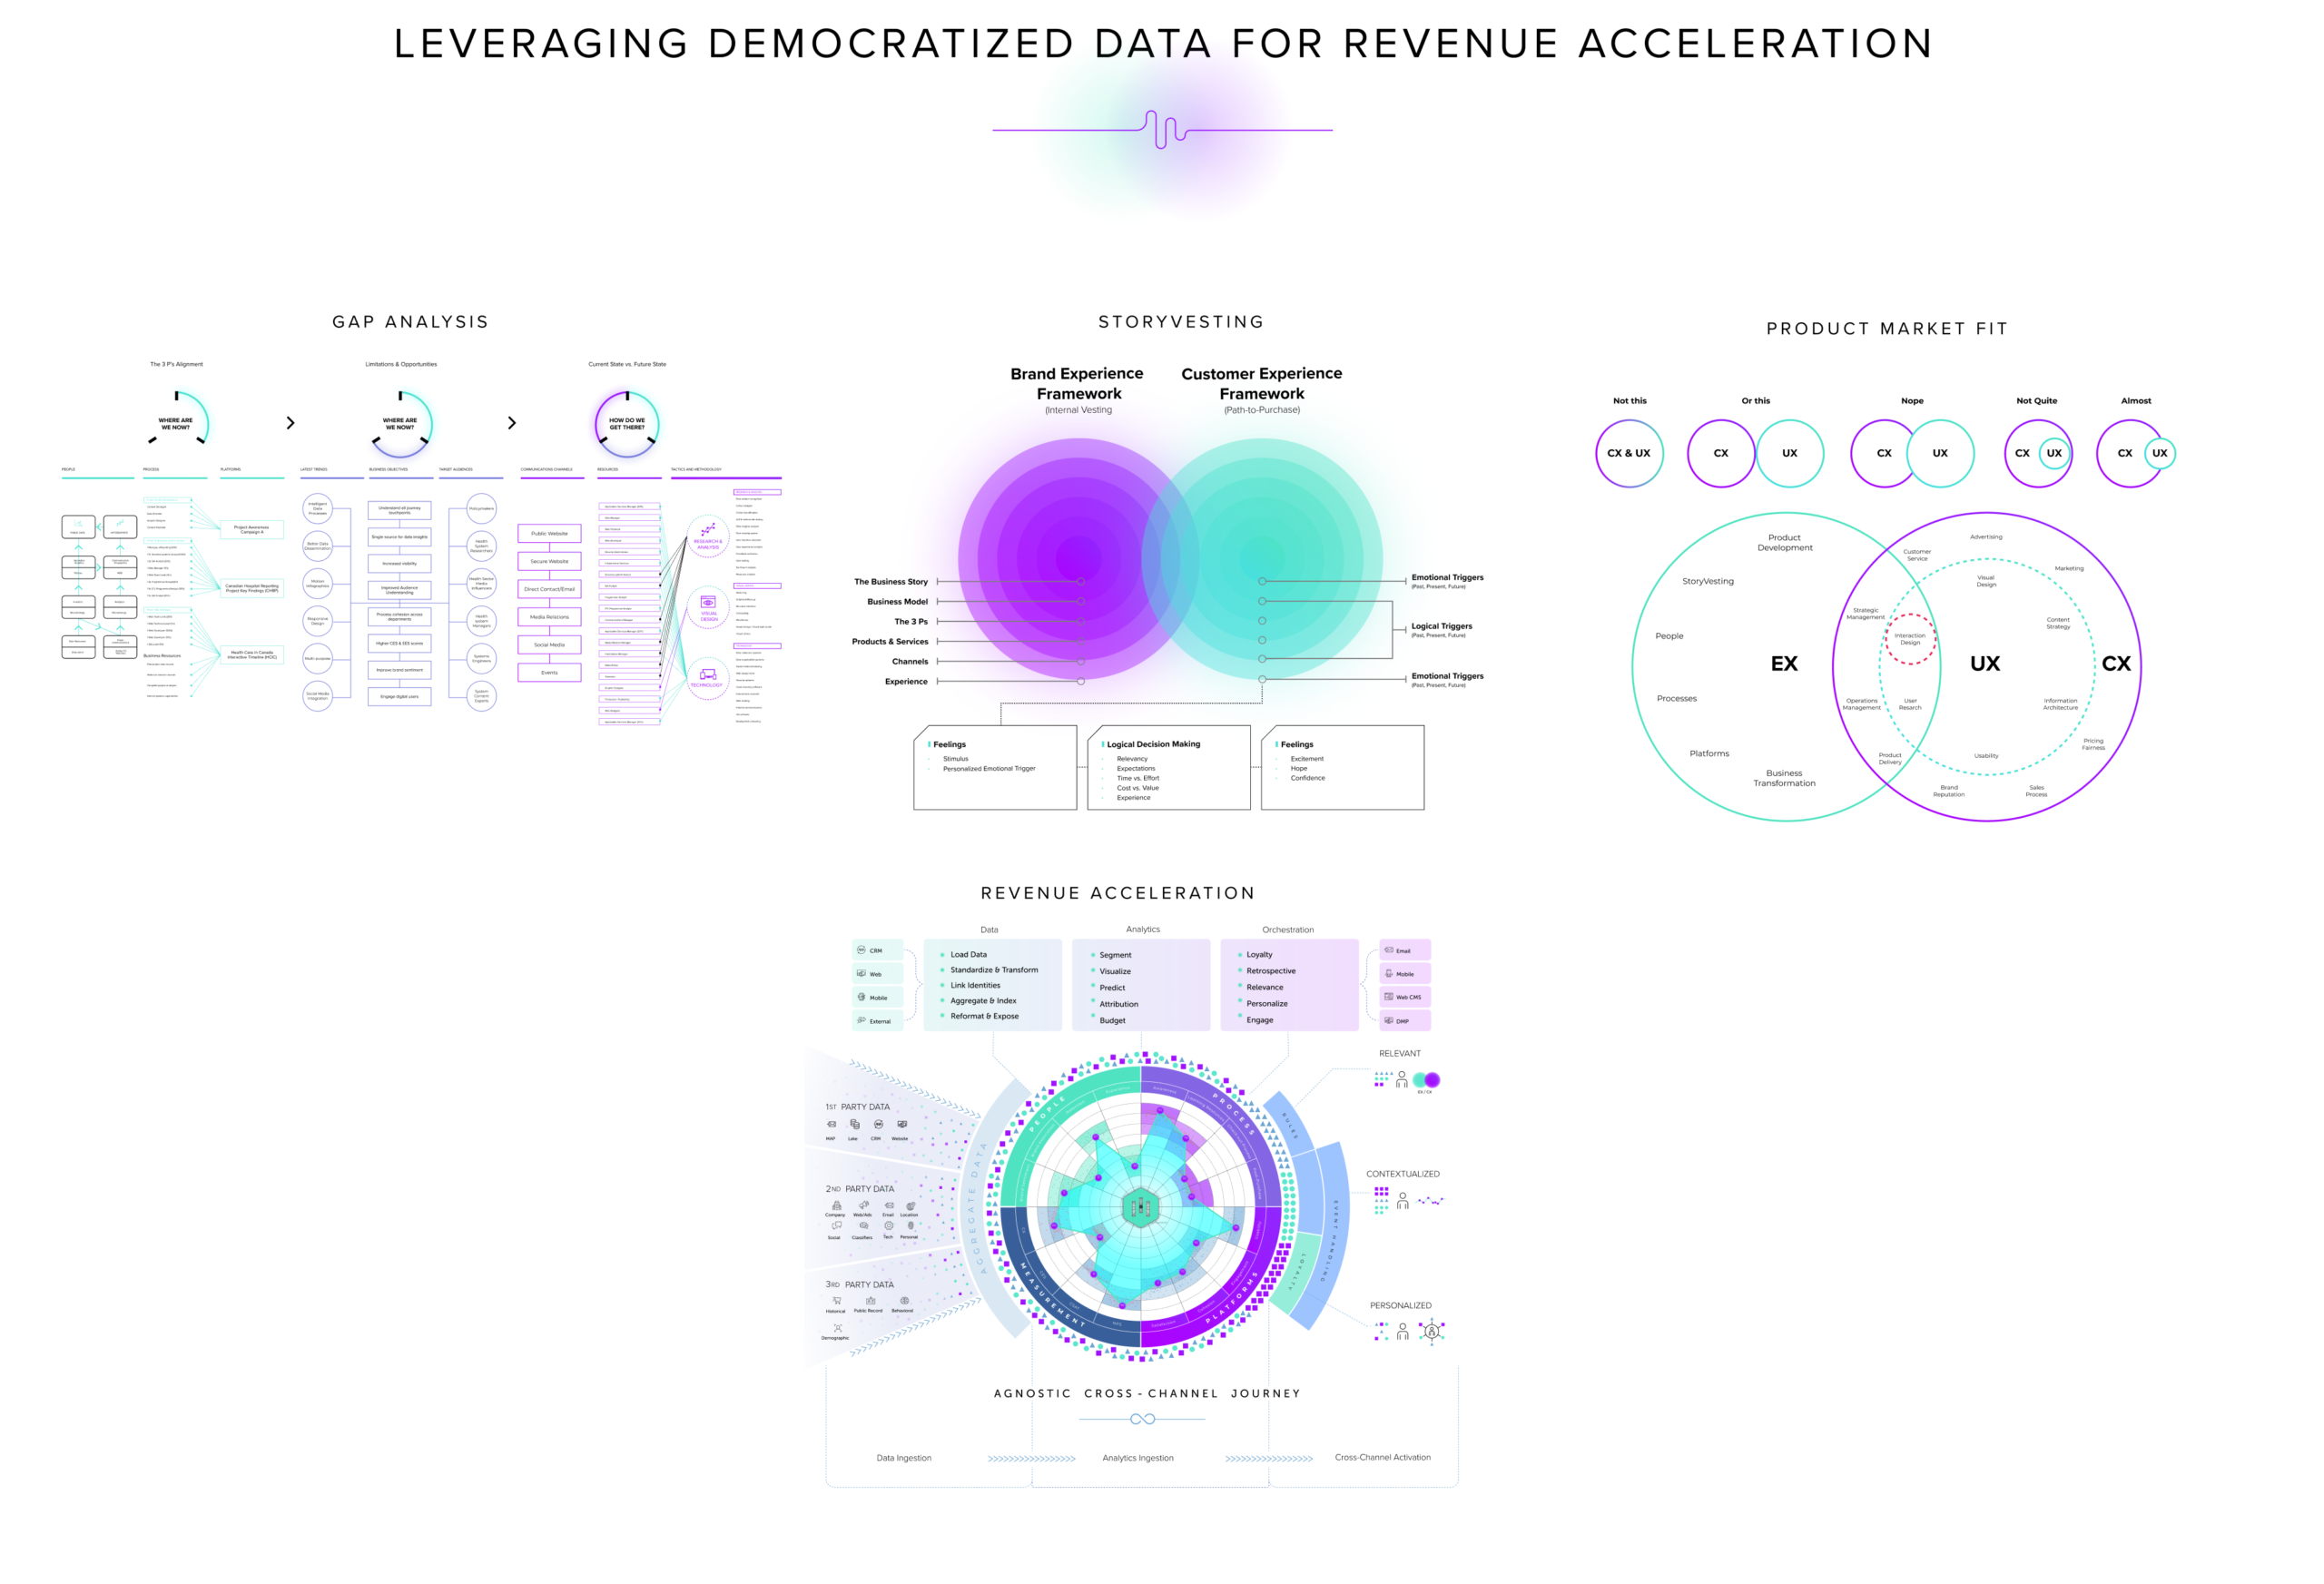
Before recommending any new strategies, we break down a gap analysis. Inside this analysis, we can better understand the tech stack, the organizational chart, the key stakeholders, how the operations unfold, and how the product/services are delivered. With that complete, we then break down the business model and look at how the organization makes money while training the team on the StoryVesting framework.
It’s typically at this stage that we start to get a lot of questions about how to leverage the democratized data to bring in more leads and make more money. Marketing wants to know how to spend their budget and leverage an attribution model to understand the data better. Sales want to define better the lead quality they receive. Customer success teams want to understand better Product-Market Fit and the data that will tell if it’s been achieved and if the offerings are still relevant. We need to monitor and understand the Cost of Acquisition to Lifetime Value ratios (CAC:LTV) to know how financially sound the offer and efforts are.
With this data collected, we can develop a single source of truth where we’ve democratized the data collected across all departments. This top-down baton handoff works well across each area. For example, if marketing spends money in the right place at the right time, then sales should have a much easier job of capturing the market ready to receive the sales message. Then, when the customer goes through onboarding, and we have Product-Market Fit, they’re more likely to go through a sublime onboarding experience and stay longer.
Data Democratization Initiatives Don’t Happen Overnight
While this process sounds good in writing, it’s undoubtedly a long journey. Having a guide who has walked through this process and navigated the new and emerging technologies around democratizing data and data collection is critical.
Despite all of the data regulations unfolding and changing platforms, it’s possible to still be effective in the marketplace. Getting started begins with getting on a discovery call with our team. We can dig deeper on that call and better understand your current position, roadmap, and team’s biggest hurdles.
Do you want more help navigating a data democratization strategy for your organization?
Schedule Your Complementary Data Democratization Consultation
![]()
Jonathan is a strategic technologist and has been designing and deploying custom technology and digital solutions for almost 20 years. His ability to successfully execute on a technology strategy is underscored by his skill in anticipating and managing the tech stack, the processes requirements and the resources needed to deliver substantial returns on investment. He has a unique ability to understand complex projects and business models and has an astute eye for navigating challenging transformation and growth assignments.
![]()
Omar Trejo has 10 years of helping DTC/eComm startups and midsize companies achieve profitable growth through marrying strategic marketing, data analytics, and powerful MarTech stacks into massive growth engines.
Downloads and Resources
Data Democratization Across Third Parties
Risk of Misalignment Without Data Democratization
Democratizing Data Across the Bow Tie Funnel and Entire Customer Experience
Data Democratization is Critical in Today's Macroeconomic Backdrop
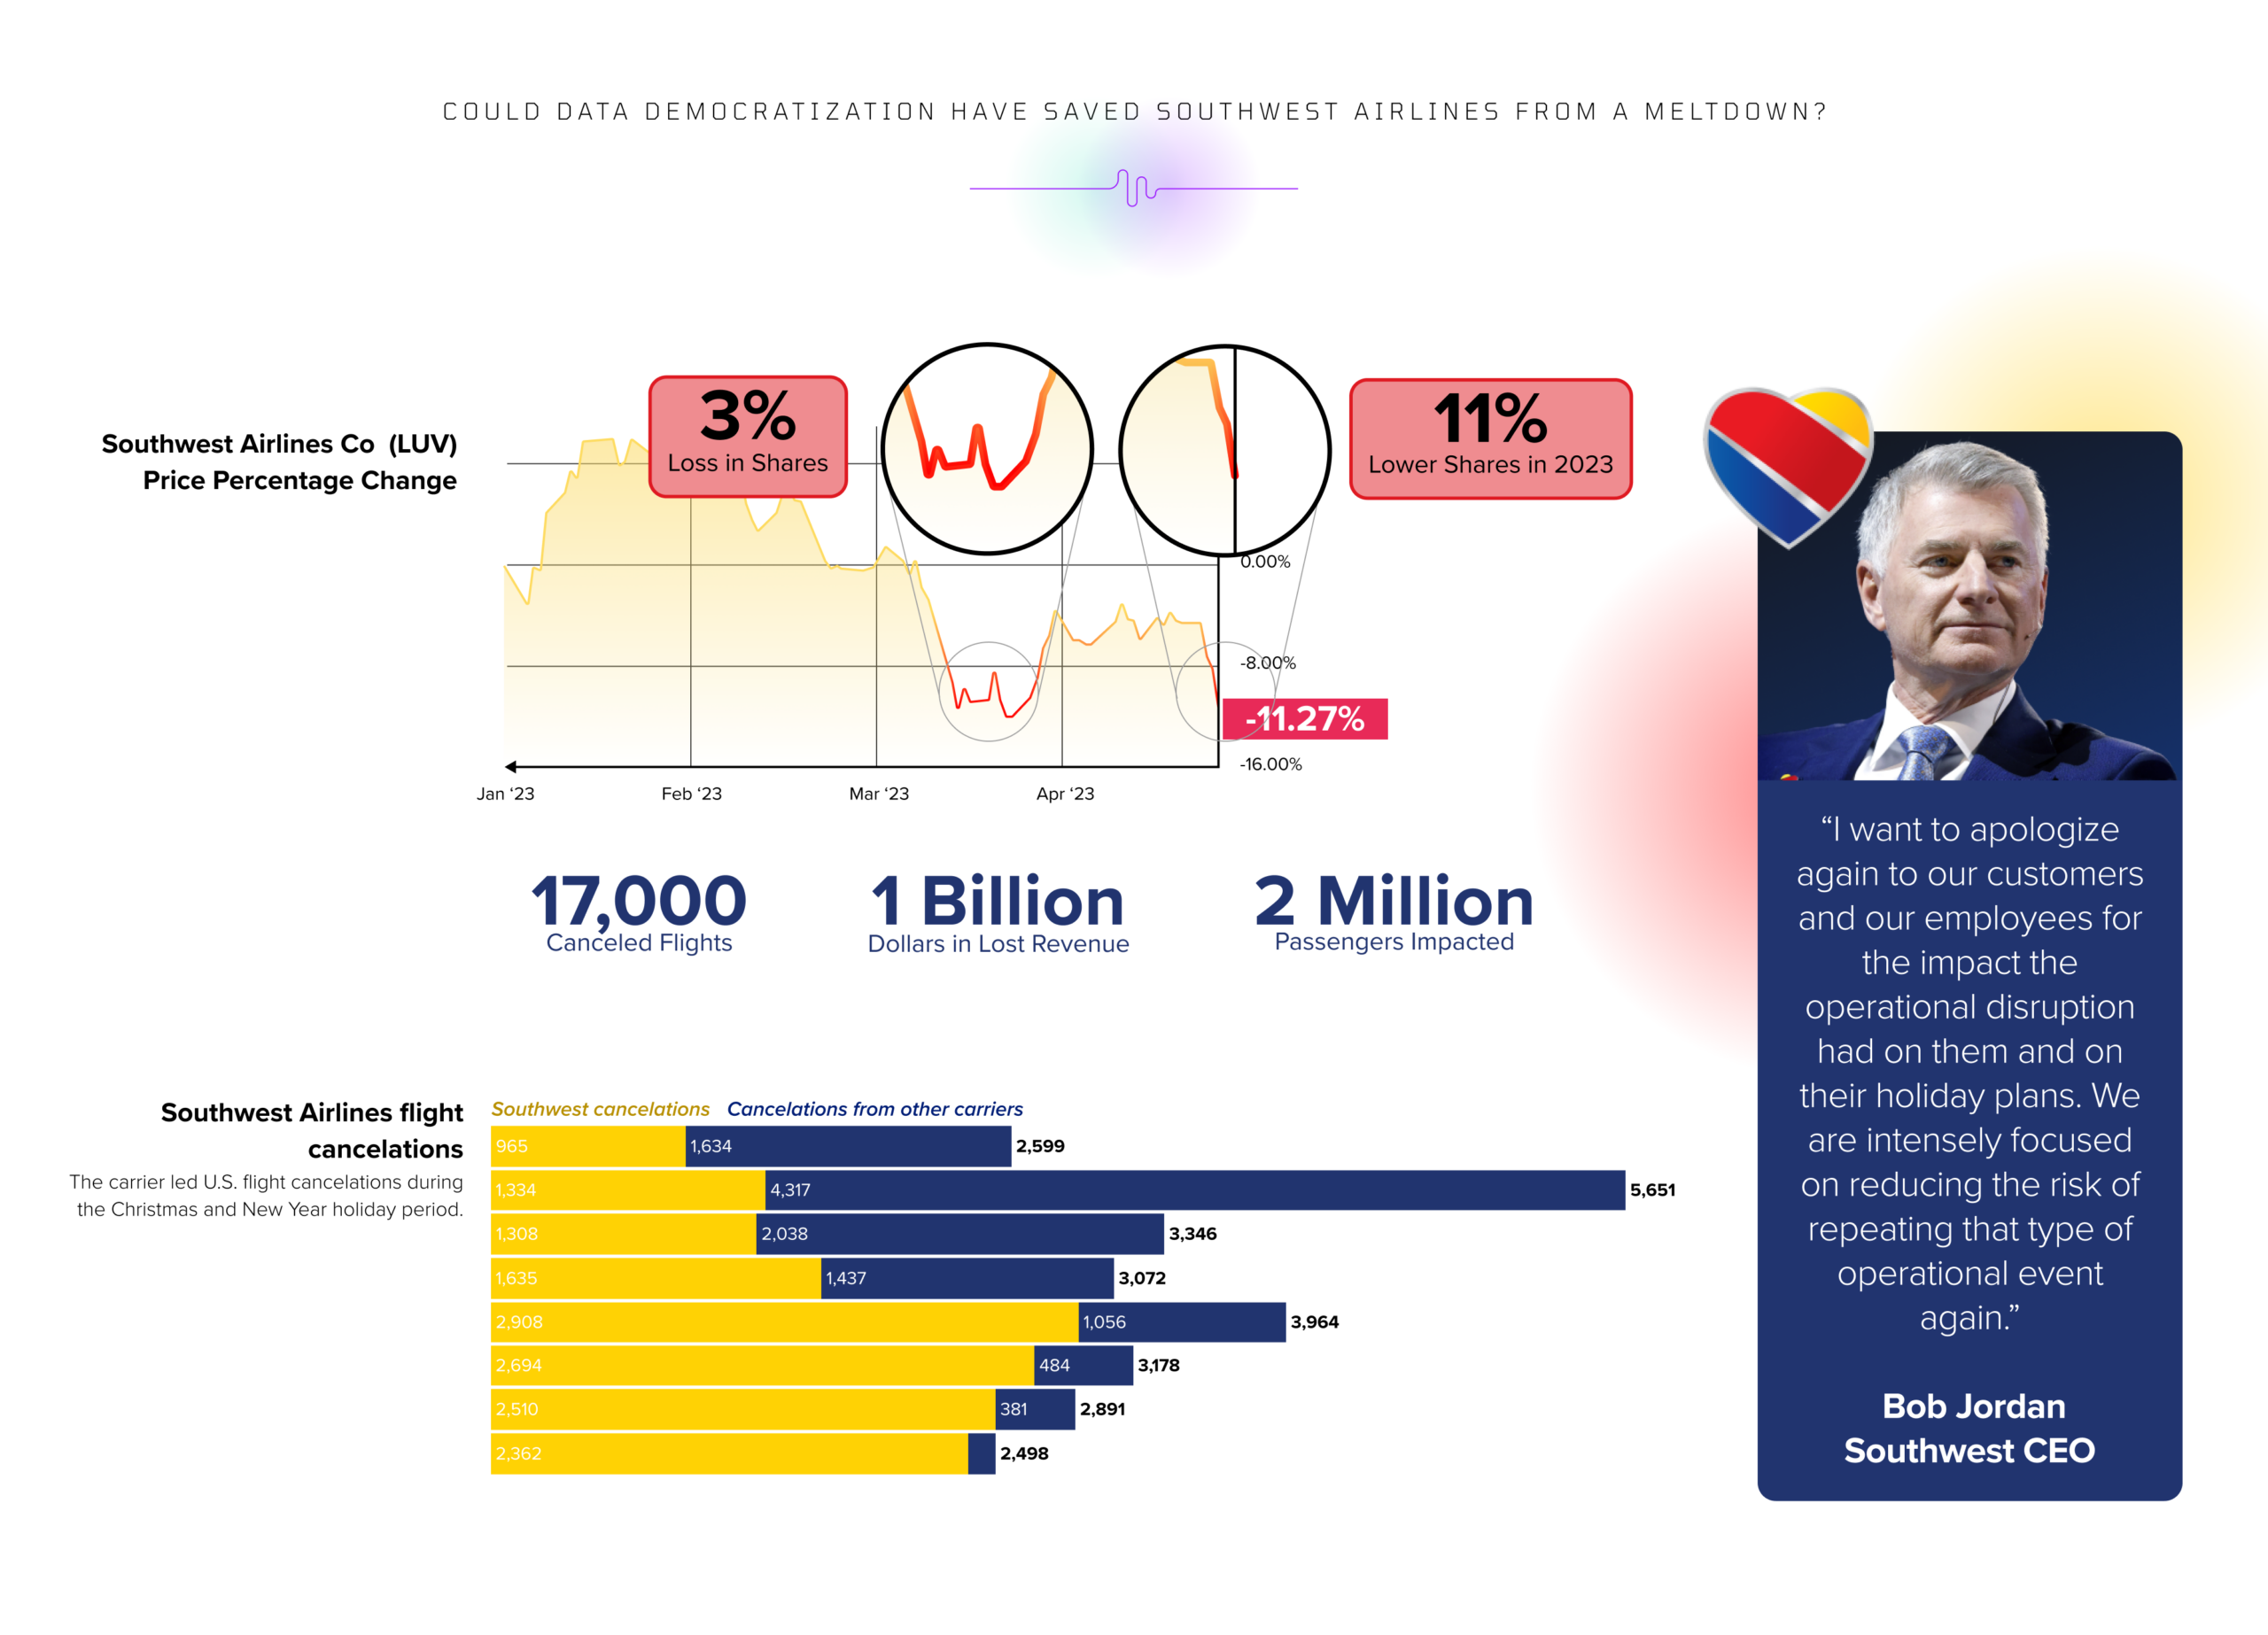
The Domino Effect of Avoiding Data Democratization
Leveraging Data Democratization to Fuel More Robust Customer Experiences
How Misalignment of Data Can Cause Significant Growth Concerns
The Importance of Innovation of Data Democratization Across the Insurance Industry
Settling Attribution Issues Using Data Democratization
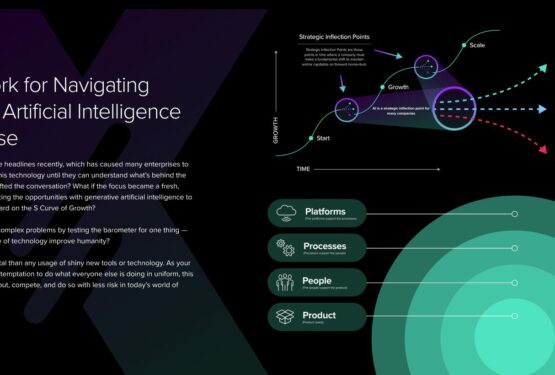
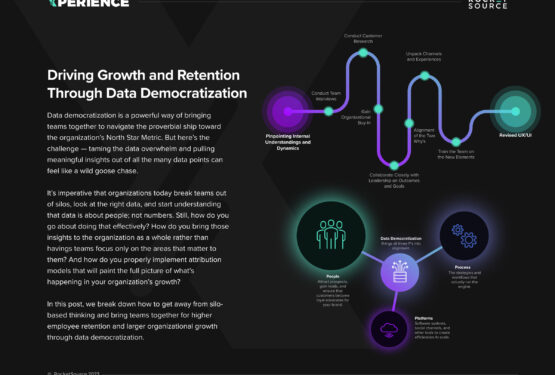
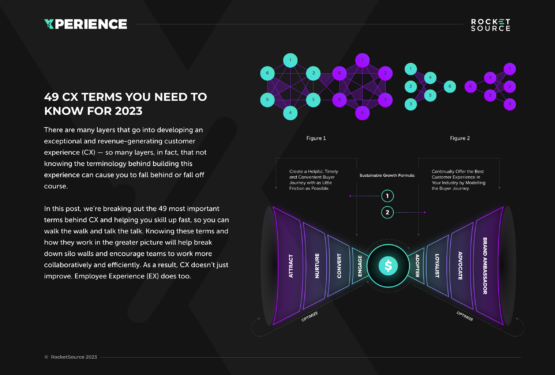
When it comes to creating more growth and revenue opportunities, data democratization is crucial to understand. In this post, we break down the risks of not democratizing data and the methodology we use when leveraging a more cohesive and strategic approach to data analysis.
Co-Founder/CEO | RocketSource
Director of Data and Analytics