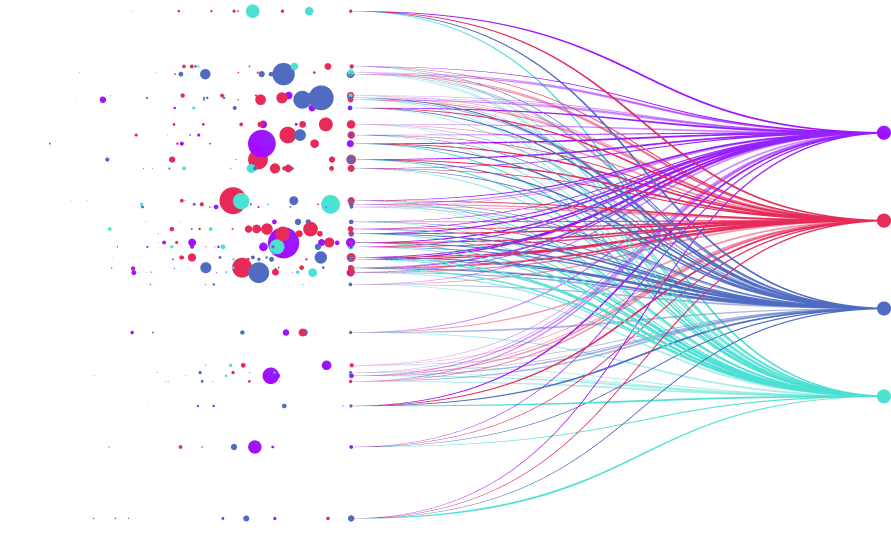
Data visualization visually displays insights so organizations can make data more accessible company-wide. This approach allows companies to identify patterns in complex data sets, gain buy-in from teams and stakeholders, and disseminate information to teams in a clear and easy to understand.
No matter how analytical teams might be, moving the presentation of key data points away from rows and columns will help your employees extract what’s needed to drive transformational initiatives. The core purpose of data visualization is to make it easier to identify patterns and connections that matter. Visualizing complex data can tell a clearer story and help teams focus on the information that matters most. Through this more digestible approach to data analysis, executives can gain additional buy-in on just about any initiative.
A Human Approach to Data Visualization
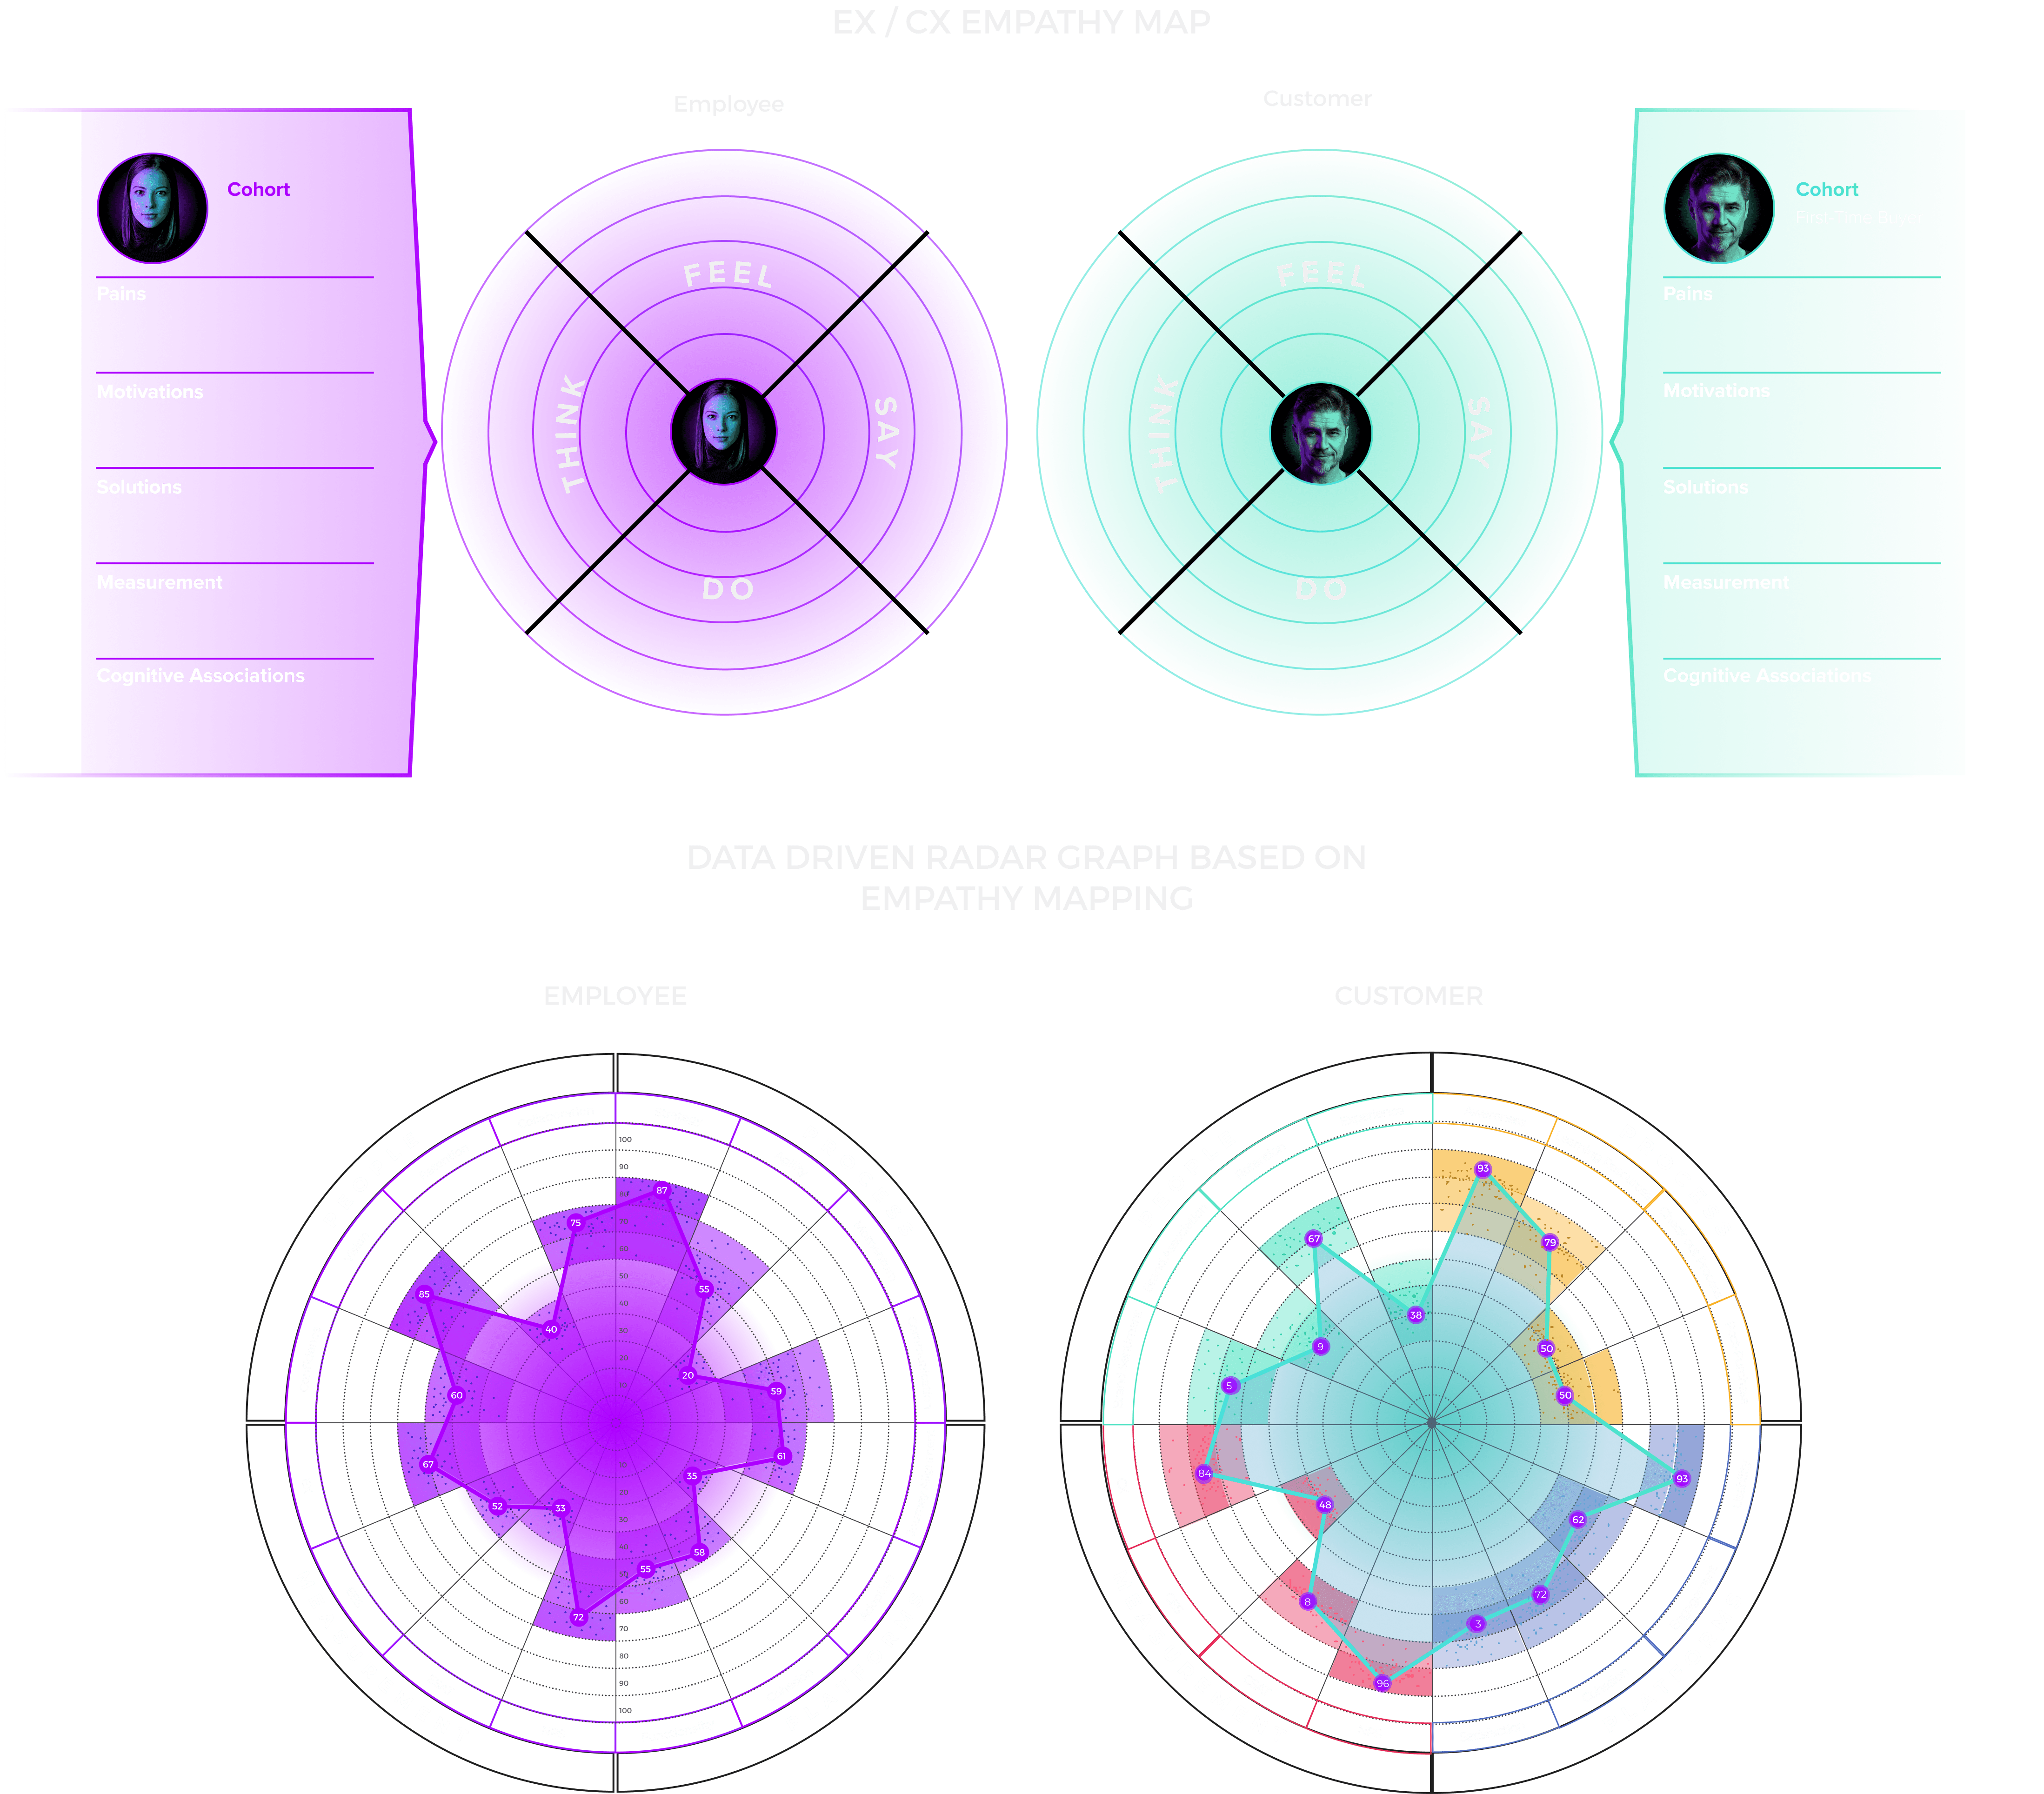
Putting data points into charts and graphs isn’t enough to reach the level of insights that will direct your organization’s path forward. Data visualization requires empathy to get deeper into the root cause of customer and employee behaviors and gain insights into actions you can take to influence the decision-making process.
Empathy in data visualization allows teams to understand the story behind the rows and columns of raw data. It’s what allows the qualitative and quantitative data to come together to tell a stronger story behind the myriad of business metrics out there.
Taking an empathetic and human-centric approach to data visualization ultimately helps teams understand the story behind data by bringing context to the why behind customer behavior.
Visualizing the Journey
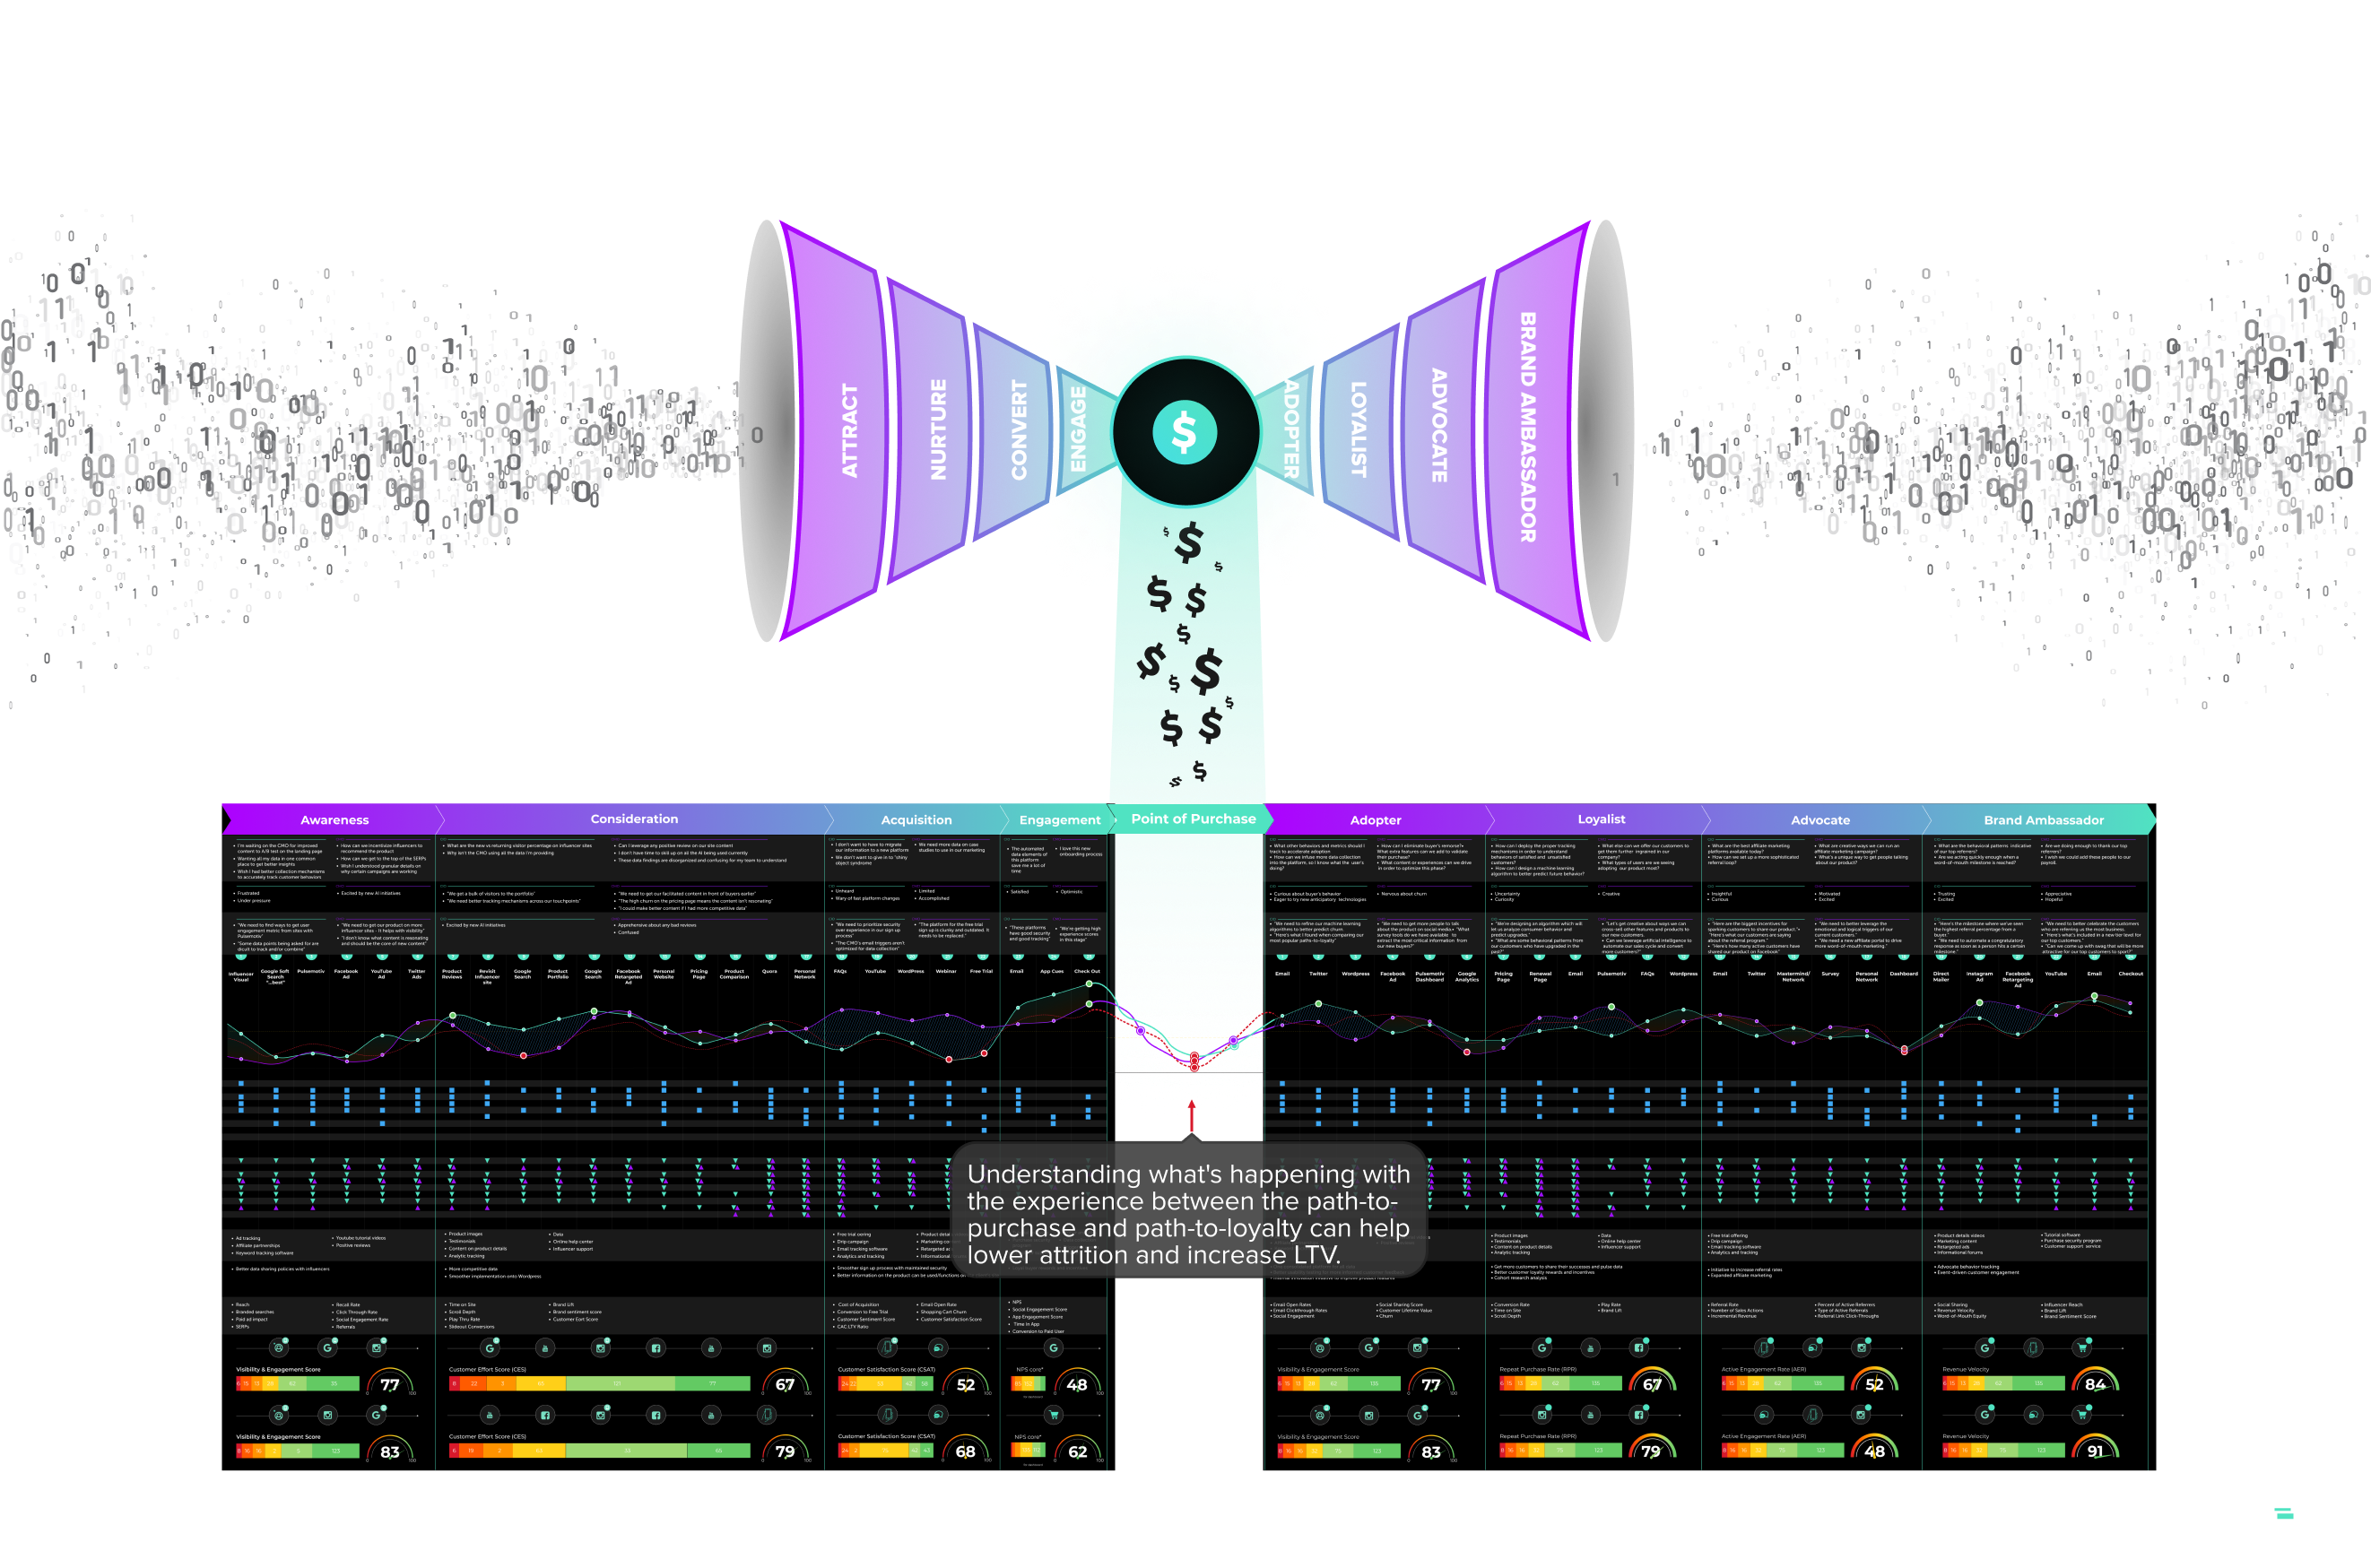
Data visualization does more than compare surface-level metrics. To truly reach deeper insight that will drive an organization’s results, teams must be able to zoom out to the 30,000-foot level while simultaneously zooming into the micro-moments where decisions are made.
Having clean data that points to the buyer and organization’s why helps uncover deep-rooted motivations. Visualizing these data points in a digestible and deep journey map lets teams know how well their work is moving the needle toward the overarching organizational goals.
This holistic vision of business allows teams to take a macro view of trends overall or zoom in for a closer look at the various micro-experiences that make up the end-to-end journey. By gathering and presenting data in this format, teams can keep a finger on the pulse of the business.
Gaining a Holistic View of Business
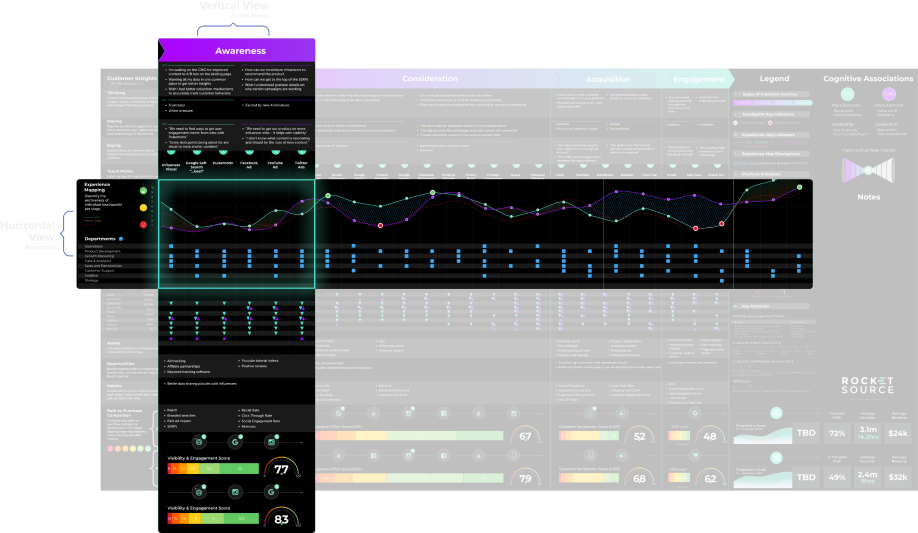
Data visualization must tell a strong story. Infusing data points into a visualization that tells a strong story allows teams to look horizontally at what’s happening throughout the buyer and employee’s experience and vertically at what’s happening within each touchpoint.
Leveraging data visualizations allows teams to get deeper into the root causes of experiential problems rather than focusing on one-off initiatives alone.
There are endless ways to represent data visually, and doing this effectively – in a way that everyone in your organization easily digests – takes both art and science. To fully capture the story data tells and then convey that message to others through data visualizations requires organizations to merge human skills in data mining and technological advancements such as machine learning.
Core Traits of Data Visualization Success
The ultimate goal of data visualization is to get to the why behind the facts and figures. This requires a team effort in modeling and mining data sets. All parties managing data sets must think and operate like scientists, psychologists and anthropologists.
Think Like a Scientist
Scientific fact-finding allows organizations to become more agile and make big business decisions rooted in data. The idea is simple on the surface. Teams make a guess, implement a change as an experiment, and then analyze the results.
While this approach is popular in data-driven decision-making, it tends to be a little superficial because it doesn’t show why something worked or what consumers want.
Think Like a Psychologist
Despite having a world of data available, organizations still don’t know with certainty why someone pulls out their credit card and buys. Psychology digs deeper into human thought processes and emotions behind decision-making.
The better teams can deeply understand the psychological motivation behind a purchase, the better they can understand and improve customer and employee experiences.
Gap Analysis
Understanding how customers use products and engage with services is powerful. This is most often best done the consumer’s natural habitat or augmented reality.
Thinking like an anthropologist guides teams in collecting evidence from the field, such as concrete examples of consumer behavior or audio from customer service phone calls. In gathering this evidence, teams uncover something far deeper than what surface-level statistics can show—context.
Customer Experience (CX) Terms
- 360° Degree View of the Customer
- AI Ops
- Barlow Bands
- Behavioral Triggers
- Bow Tie Funnel
- Brick-to-Click
- Business Impact Analysis (BIA)
- Cognitive Computing
- Cohort Analytics
- Content Mapping
- Conversational User Guidance
- Customer Data Profile
- Customer Experience (CX)
- Customer Friction
- Customer Insights Map
- Customer Journey
- Customer Journey Mapping
- Customer Satisfaction (CSAT)
- Customized Ratios
- CX Intelligence
- CX Led Growth
- CX Metrics
- Data as a Product (DaaP)
- Data as a Service (DaaS)
- Data Culture
- Data Driven
- Data Engineering
- Data Fabric
- Data Governance
- Data Humanization
- Data Hygiene
- Data Looping
- Data Mapping
- Data Mining
- Data Modeling
- Data Monetization
- Data Swamp
- Data Visualization
- Data Warehouse
- Data-Centric
- Descriptive Analytics
- Diagnostic Analytics
- Digital Asset Management (DAM)
- Digital Transformation
- Dirty Data In Dirty Data Out
- Embedded Intelligence
- Empathy Mapping
- Employee Data Profile
- Employee Experience (EX)
- EX to CX Data Mapping
- EX to CX Mapping
- Experience Management (XM)
- Gap Analysis
- Generative AI
- Human-Centered Design (HCD)
- Journey Analytics
- Machine Learning (ML)
- Managed Agile Services on Demand
- Modified Hoshin
- North Star Metric
- Party Data
- Pathway to Purchase
- Predictive Analytics
- Product-Market Fit Mapping
- Real Time Design Looping
- Revenue Acceleration
- RevOps
- S Curve of Growth
- Stack Impact Analysis
- StoryVesting
- Table Stakes Testing
- The 3 P’s
- User Experience (UX)
- User Insights Map
- User Interface (UI)
- Voice of the Customer (VoC)
- Voice of the Employee (VoE)
- World Cloud Generator Sentiment Mining
- X Analytics

