Compilation of Customer Data
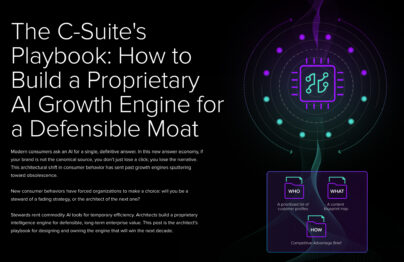
A business impact analysis, or brand experience impact analysis, is the process of plotting possible business objectives against each other to identify the lowest hanging fruit for growth. By prioritizing these objectives, organizations can schedule and track the implementation of each associated initiative. Structuring a roadmap in this way empowers organizations to fuel growth, drive retention and maximize resources through better operational efficiencies.


Prioritizing Opportunities for Quick Wins
Bubble charts of business impact analysis offer a quick and easy visualization of complex decision-making. There are many nuances baked into this simple, yet stunning visual. From the colors used to the sizes of the bubbles, and even the structure of the various quadrants, these maps make it clear which direction to pursue.
Showcasing your organization’s roadmap through color and depth makes it easier to tell a stronger story about how and why you’re prioritizing your business in this way. This is critical to seeing experiential initiatives to completion.
A Business Impact Analysis That’s Easy to Digest is Easier to Implement
Knowing what will make the biggest impact on your organization is only half the battle. You must also turn those plans into a roadmap that will get approved, rolled out on budget, and put the right team on the bus to see it to completion.
Data-driven imagery is used to reinforce powerful concepts that are often difficult to grasp. By visualizing the business impact analysis in this way, you’re able to simplify how teams see their role, their purpose, and find innovative ways to move the organization ahead.


An Actionable Roadmap for Improvement
Assets, such as business impact analysis, can be leveraged in a wide variety of ways simply because of how it is visualized. The human mind is only able to juggle so much on its own. When visualizing the business impact analysis in a way that’s easy to understand, you can quickly disseminate it across your organization and put those plans into action.
This map is frequently pulled out at weekly planning meetings to assess the status of the projects. In using it over and over again, teams can stay on track by taking the guesswork out of where to go or which tasks need to be prioritized to meet your goals.
An Experiential Strategy to Fuel Growth
It’s often assumed that tracking growth starts with tracking metrics alone. While metrics are informative, solving problems requires more than monitoring outputs. Instead, it relies on getting out ahead using a business impact analysis to fuel growth, so you can then better understand what’s happening when you visualize and track these core growth, retention, and operational metrics.


Customer Experience (CX) Terms
- 360° Degree View of the Customer
- Agentic AI
- AI Ops
- Annual Recurring Revenue
- Behavioral Economics
- Behavioral Insights Matrix
- Behavioral Triggers
- Bow Tie Funnel
- Brick-to-Click
- Business Impact Analysis (BIA)
- Cognitive Computing
- Cohort Analytics
- Content Mapping
- Convergence / Divergence Bands
- Conversational User Guidance
- Customer Data Profile
- Customer Experience (CX)
- Customer Friction
- Customer Insights Map
- Customer Journey
- Customer Journey Mapping
- Customer Satisfaction (CSAT)
- Customized Ratios
- CX Intelligence
- CX Led Growth
- CX Metrics
- Data as a Product (DaaP)
- Data as a Service (DaaS)
- Data Culture
- Data Driven
- Data Engineering
- Data Fabric
- Data Governance
- Data Humanization
- Data Hygiene
- Data Looping
- Data Mapping
- Data Mining
- Data Modeling
- Data Monetization
- Data Swamp
- Data Visualization
- Data Warehouse
- Data-Centric
- Descriptive Analytics
- Diagnostic Analytics
- Digital Asset Management (DAM)
- Digital Transformation
- Dirty Data In Dirty Data Out
- Domain Specific Models
- Embedded Intelligence
- Empathy Mapping
- Employee Data Profile
- Employee Experience (EX)
- EPS
- EX to CX Data Mapping
- EX to CX Mapping
- Experience Management (XM)
- Foundation Models
- Gap Analysis
- Generative Adversarial Network
- Generative AI
- GEO
- Hallucinations
- Human-Centered Design (HCD)
- IRR
- Journey Analytics
- Large Language Model
- Machine Learning (ML)
- Managed Agile Services on Demand
- Model Training
- Modified Hoshin
- MRR
- Neural Network
- North Star Metric
- Party Data
- Pathway to Purchase
- Predictive Analytics
- Product-Market Fit Mapping
- Real Time Design Looping
- Revenue Acceleration
- RevOps
- ROAS vs. ROI
- S Curve of Growth
- Stack Impact Analysis
- StoryVesting
- Table Stakes Testing
- The 3 P’s
- Transformers
- User Experience (UX)
- User Insights Map
- User Interface (UI)
- Vector Database
- Vector Database Copy
- Voice of the Customer (VoC)
- Voice of the Employee (VoE)
- X Analytics