The TL;DR* of this article
*Too Long, Didn't Read
- Beginner
- Intermediate
- Advanced
Post Summary
Why Traditional Analytics Aren't Working Anymore
The analytics that worked a few years ago won't work to help you understand today's more nuanced, complex, modern consumer behavior.How to View Your Customer Journey Analytics
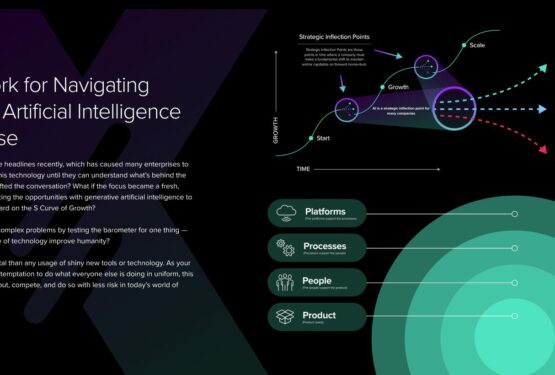
By using a framework to analyze the customer's journey and guide your growth initiatives, you'll be better positioned to move up the S Curve of Business.Why Customer Journey Analytics Are Critical Organization Wide
Customer journey analytics cannot live in a silo. To be effective, they must be used throughout your organization.

How do you uncover what’s really happening across your buyer’s journey? You dive head first into your customer journey analytics, right? But how do you know you’re getting the best insights to truly understand what your customers are thinking, feeling, saying and doing? That’s what we’ll cover in this post. But first, a little background about why this matters.
When Newbase surveyed Chief Marketing Officers (CMOs) worldwide, almost half (49%) said one of their biggest areas of focus in 2018 was understanding the needs of consumers and the customer journey. This understanding cannot come from guesswork. It must be drawn from the data available to businesses today.
Although Newbase only surveyed CMOs, the implications of the customer’s journey extend throughout the organization. Everyone in your organization, from the sales and marketing teams to data scientists, human resources and all departments in between, must understand what’s happening from start to finish in your buyer’s journey. Unfortunately, many departments don’t have a deep enough view of this process to fully understand it. When understanding of the customer journey is not the same throughout the organization, silo walls go up, causing everyone to be working toward different business outcomes.
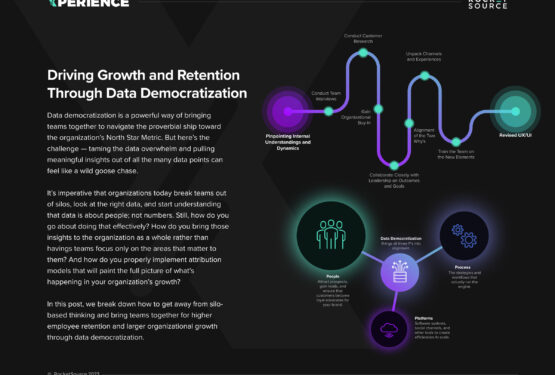
Today’s businesses cannot continue to operate in silos. Dropping these internal barriers begins by democratizing your data and getting everyone on the same page about how to improve the overall customer experience. That effort starts with sharpening your approach to customer journey analytics.
What Are Customer Journey Analytics Anyway?
Gartner defines customer journey analytics as:
The process of tracking and analyzing the way customers use combinations of channels to interact with an organization.
These channels include any area where the customer interfaces directly with your organization, including call centers, websites, live chat capabilities, audio sound bites like the one in the TL;DR of this post, retail stores and much, much more. As you gather data from each of these channels, you’re able to analyze what’s happening along the customer’s journey and quickly uncover failing experience initiatives.
If you’ve read our post about creating your customer journey map, you know just how much the buying process has changed over the last decade and thus, the importance of tracking what’s happening at each touchpoint. Consumers today flock to organizations that offer faster service, more personalized care, and experiences that extend long past the purchase. They embrace brands that provide timely, helpful messages in the right place at just the right time. Although a customer journey map can help you understand how and when to deliver that content, it’s customer journey analytics that tells you how well messages are received and where growth opportunities lie.
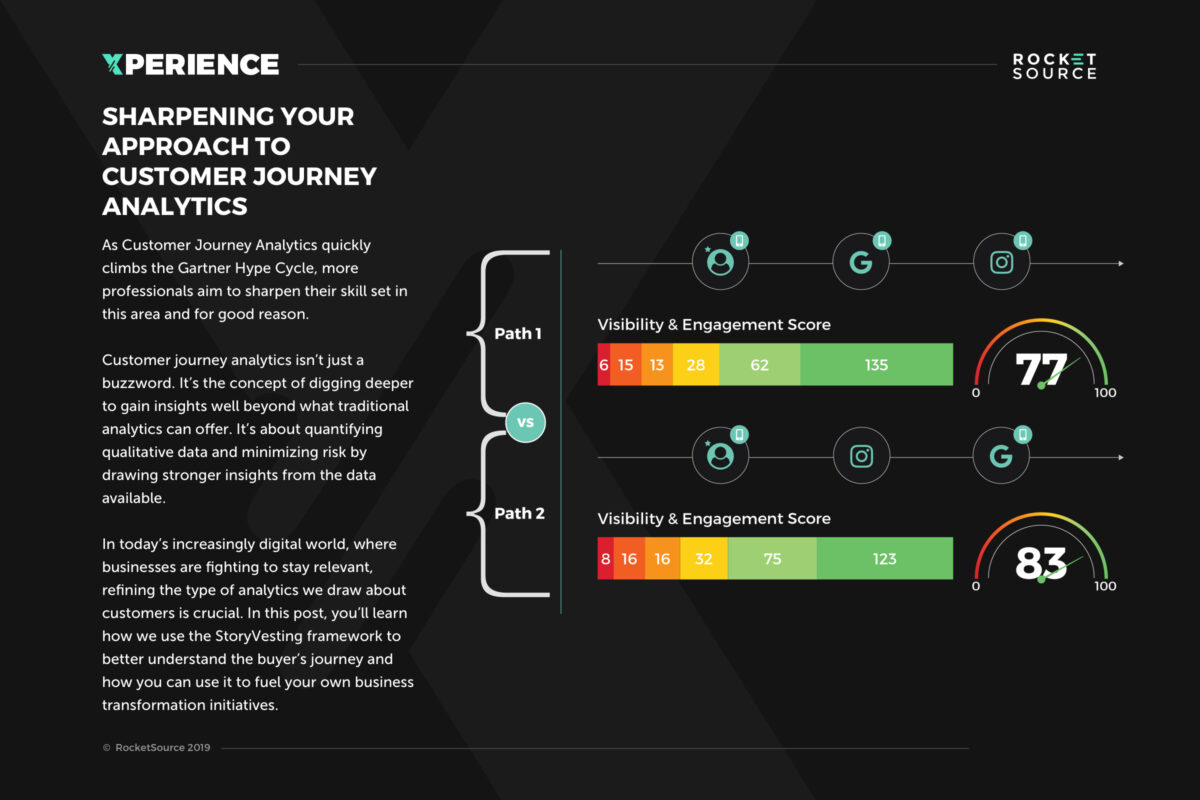
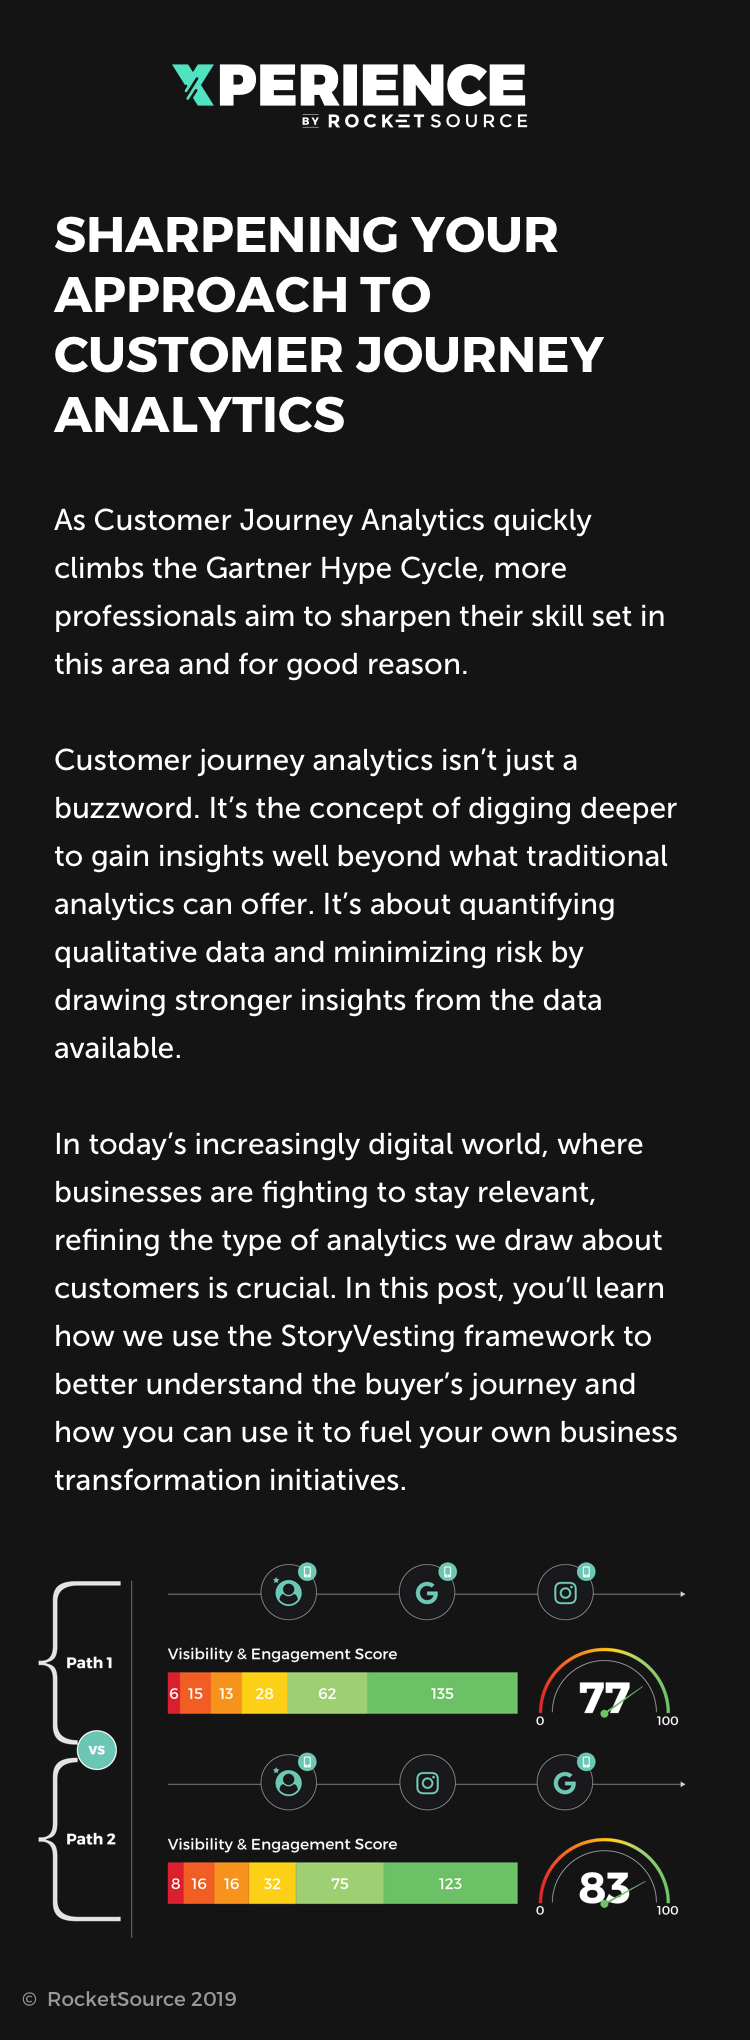
As you can imagine, the insights gleaned from this type of analysis are powerful. It’s perhaps for this reason that customer journey analytics has made its way onto on the Gartner Hype Cycle and continues to climb toward the peak of inflated expectations.
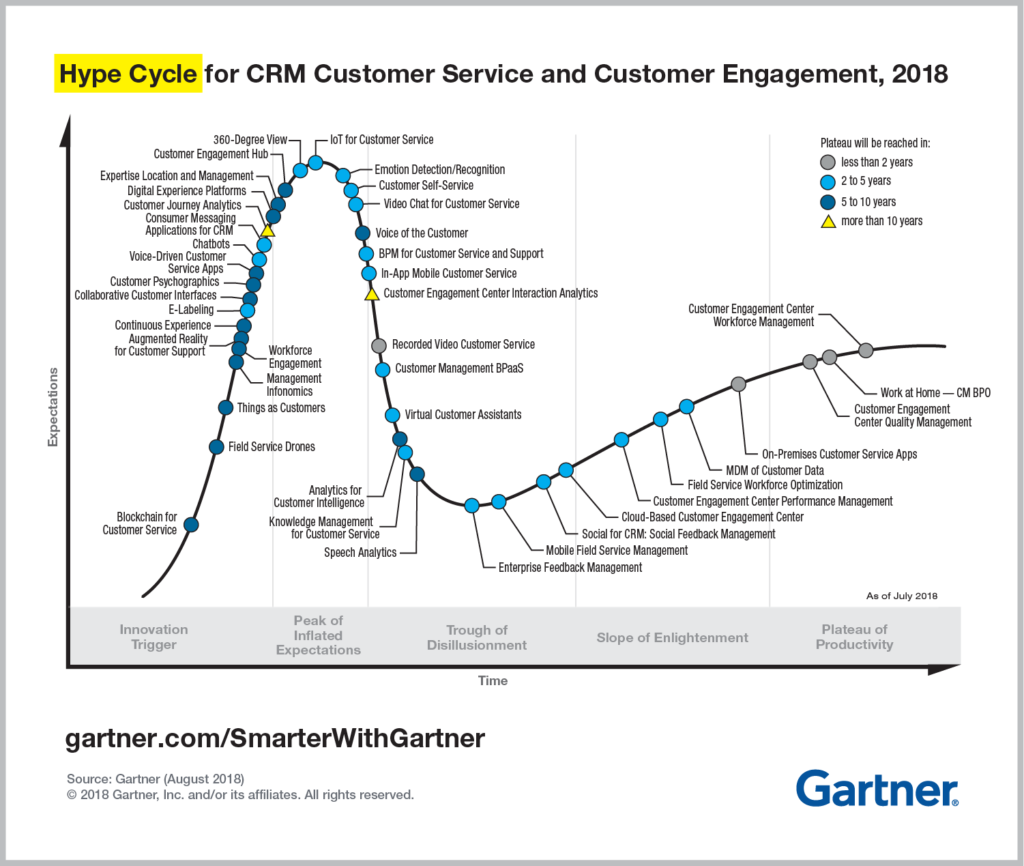
It’s estimated that we’re still 5-10 years out from customer journey analytics reaching the plateau of productivity. Yet, now’s the time to start getting your hands dirty analyzing available data about your customer. It’s in this data that opportunities await. But data in itself is overwhelming at best, which causes many people to just skim the surface of what’s available, thus failing to gain deep insights.
If you’re still stuck looking at traditional analytics, you’re missing a critical piece of information. And if you’re just skimming the surface, you’re missing out on substantial growth opportunities.
What Traditional Analytics Look Like and Why They’re Failing You
Data is the foundation of analytics. Without it, there’s nothing objective to analyze, which leads to pure guesswork.
And yet, data has become a four-letter word to many organizations (see what we did there?) because there’s so much of it out there. How do you tame the data beast and extract meaningful insights? The answer for many businesses is to find ways to use traditional analytic methods. While this approach might be easier, it’s a mistake. If you’re still stuck looking exclusively at traditional analytics, you’re missing critical growth opportunities.
Traditional analytics tend to only scratch the surface of your buyer’s true behavior and motivations. Examples of traditional analytics include:
- Unique email addresses from people opting in for your freebie
- Unique visitors to your website
- Landing page URL hits and conversions
- Social media mentions
Each of these examples (and dozens of others not mentioned here) can sketch a general outline of what’s happening with your customer, but that picture lacks depth. By utilizing customer journey analytics to its fullest, you can build upon that foundational sketch and get an idea of the composition, value and fine details of your customer journey for a richer, more insightful image.
Customer Journey Analytics Extend Beyond Traditional Analytics
Traditional analytics demonstrate what happens at specific points along the path-to-purchase, so one way companies mistakingly try to extend insights beyond traditional analytics is by analyzing this path as a whole. Because customer journey analytics and path-to-purchase analytics are not synonymous, condensing them is a bad idea.
The path-to-purchase offers a condensed yet highly nuanced overview of the channels a person navigates when deciding to buy — for example, your website, landing page, emails or social media. The customer journey is the overarching experience a person has along the path-to-purchase. It’s a culmination of all the channels and touchpoints. The journey illustrates how they engage at each of the channels and their intent as they move forward in their journey.
The path-to-purchase itself can’t give the amount of detail customer journey analytics can, but instead takes a higher-level view of the journey. Likewise, when looking at two customer journeys side-by-side, it’s hard to see which one is most effective, shorter, more expensive, etc.
You must understand both customer journey analytics and path-to-purchase analytics to get the type of insight needed to drive customer experience (CX) initiatives.
The question we hear many people ask is, “if traditional analytics aren’t doing the job anymore, how can you use the path-to-purchase, while also making your customer journey analytics more insightful?”.
The answer: by humanizing your data and getting a clearer picture of the real people and consumers behind your business’s analytics. That’s not easy to do, but it’s necessary if you want to stay competitive in today’s market. The first step toward achieving depth and high-definition clarity is to use a framework steeped in psychology and behavioral analytics as your lens. That framework is (you guessed it if you’ve been around here much) StoryVesting.
A New Lens for Viewing Your Customer Journey Analytics
Without a doubt, tracking how people engage with your brand is essential. Still, it doesn’t provide the full picture of what’s happening behind the scenes. What do consumers think as they scroll through your website? What’s catching your buyer’s eye before they bounce? What are consumers doing before, during and after their engagement with you? What are they feeling? What are they saying to their friends about you? To gain this level of depth requires empathy and a foundational understanding of the human psyche.
We’re not trying to convince you to audit several psychology courses (although that would be valuable if you have the time and interest). Instead, we’re urging you to think more carefully about how to infuse empathy and psychology into your customer journey analytics so that you can draw more profound insights. Applying a framework built on behavioral economics and cognitive science is the way to do this. To understand how StoryVesting accomplishes this goal, let’s take a brief look back at how it came to be.
Creating The StoryVesting Framework
StoryVesting has a fascinating backstory. If you haven’t read about this business transformation framework yet, carve out some time to check it out. RocketSource co-founder Buckley Barlow is the brainchild behind StoryVesting and the subsequent frameworks and models you might have stumbled upon across the web. After studying behavioral economics, conducting research, and talking to 1,969 people, he uncovered patterns in consumer-buying behaviors that have a high propensity to lead to predictable outcomes. Insights from those nearly two thousand conversations were then informed by and combined with truths of behavioral economics and cognitive science to provide answers about how people buy.
The framework itself went through many iterations as Buckley tested and tweaked based on his research.
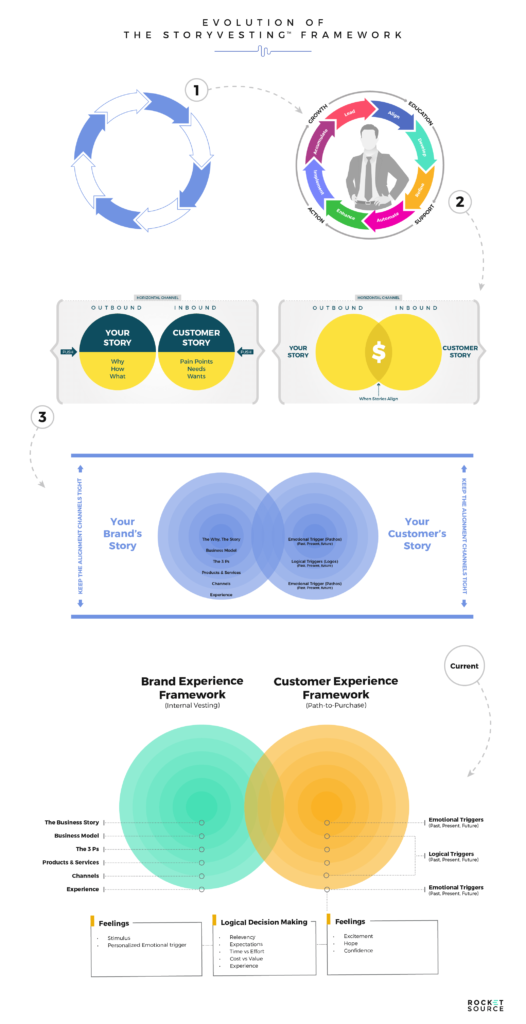
After many rounds of adjusting the framework to accommodate his findings, Buckley finalized the StoryVesting framework (and many subsequent frameworks he developed alongside StoryVesting) that we use today in every single client account. In this version, you see the fusion of two experiences — the brand experience, which answers what employees experience internally, and the customer’s experience, which addresses the buyer’s path-to-purchase.
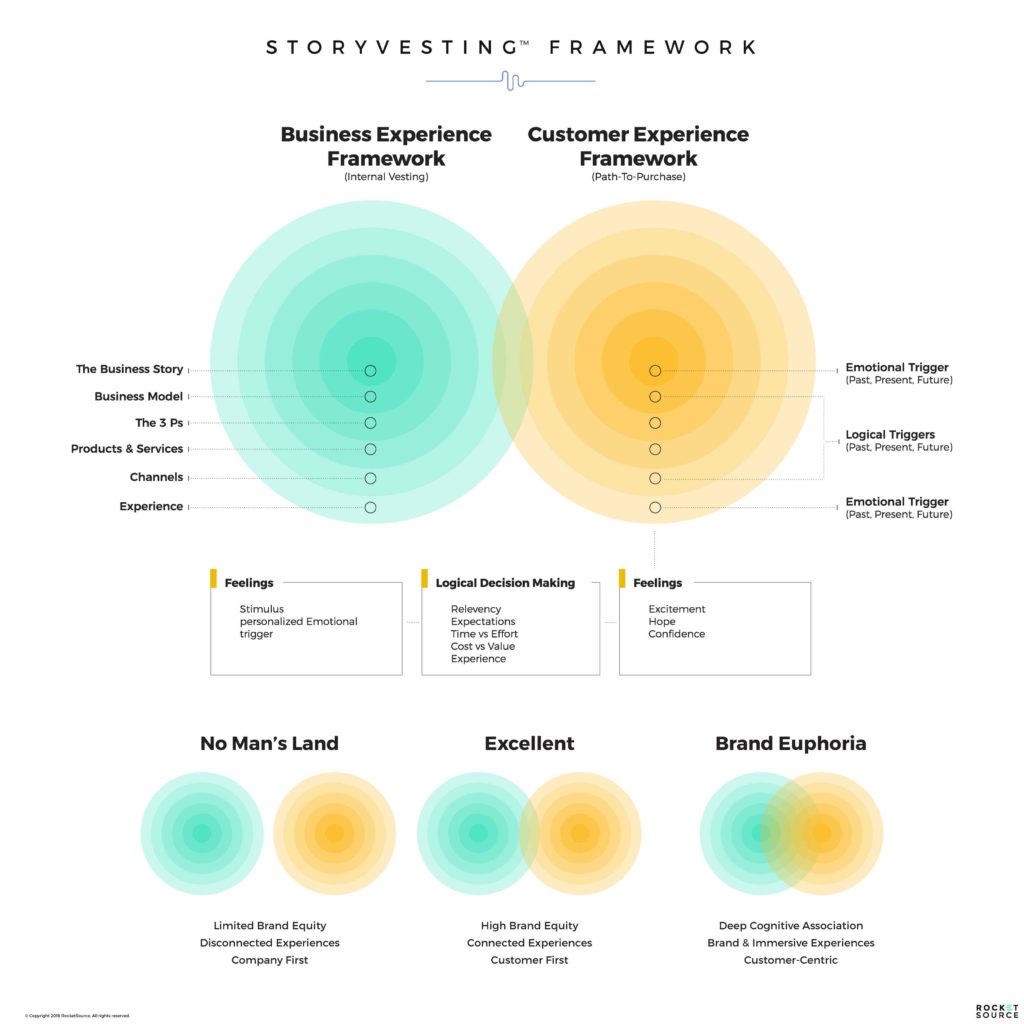
Because this is a post about customer journey analytics, let’s look specifically at the human psyche and how it’s incorporated into the customer’s experience side of the framework. As you can see on the path-to-purchase concentric circle, Buckley addresses the emotions triggered by feelings from past experiences that often occur in the brain’s limbic system. He also includes logical triggers occurring in a buyer’s neocortex that generate fundamental questions that must be answered before he or she feels comfortable pulling out a credit card. Finally, the framework ends with a combination of both emotional and logical triggers as the buyer’s past, present and future experiences are reconciled prior to their purchase.
It’s these factors that differentiate StoryVesting from other business frameworks. It addresses how your consumers approach their journey, which serves as a guide as you analyze the data at your disposal. To give you more context, let’s look more closely at the types of data available and how you can use them to get a more empathetic understanding of what’s happening along your buyer’s journey.
Quantitative Data vs. Qualitative Data (Hint: You Need Both in Your Customer Journey Analytics)
In your business, you have many types of data available to you. Structured data are essentially any numbers or figures that you can calculate. Typically, structured data is quantitative data, which means you can easily quantify it. Unstructured data includes conversations at focus groups, handwritten data and anything else that’s hard to fit into a spreadsheet. This type of data is usually qualitative and typically drawn from human motivation rather than quantifiable actions.
To gain growth insights you need both, according to Brian Balfour.

For the sake of this post, we’ll look specifically at customer journey analytics and why your view of your customer’s journey must consist of both quantitative and qualitative data.
Quantitative Data Has Both Upsides and Pitfalls
Quantitative data are available in abundance. Clicks to your website, social media shares, email open rates, click-thru rates, behavioral flow charts and many other types of data are more accessible today than ever before.
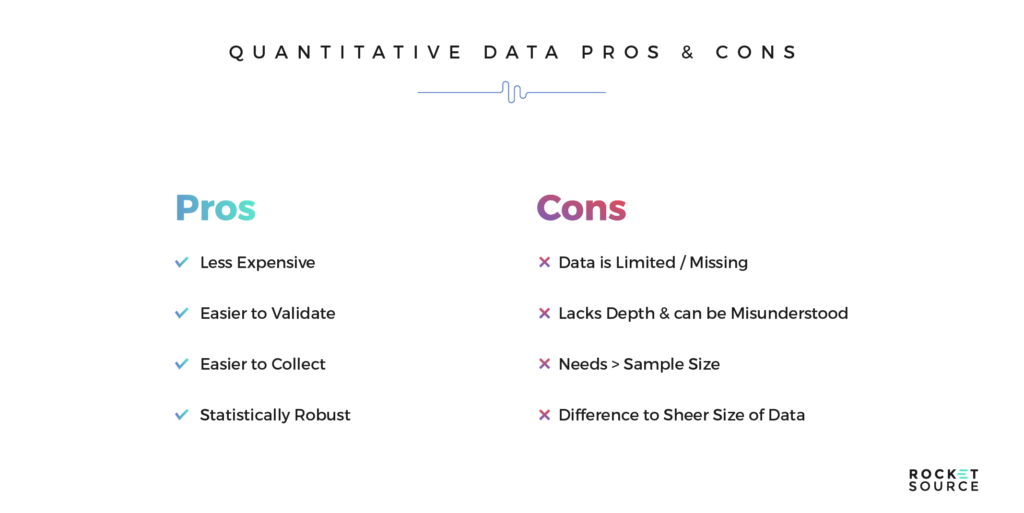
The sheer nature of quantitative data is that it is easier to collect and is statistically robust. Those are critical factors when justifying new initiatives.
Still, this type of data tends to only be effective if tracked in real time. Although quantitative data is undoubtedly helpful, it’s only part of the puzzle needed to improve your buyer’s overall experience. It’s limited, which means it’s difficult to get below the surface. That lack of depth can easily result in misinterpretation, which can lead your experience initiatives astray very quickly. One person analyzing it can come to a very different conclusion than someone else in your department unless both view it through the same lens. Even still, to understand what a buyer’s journey looks and feels like from their perspective requires richer data sets.
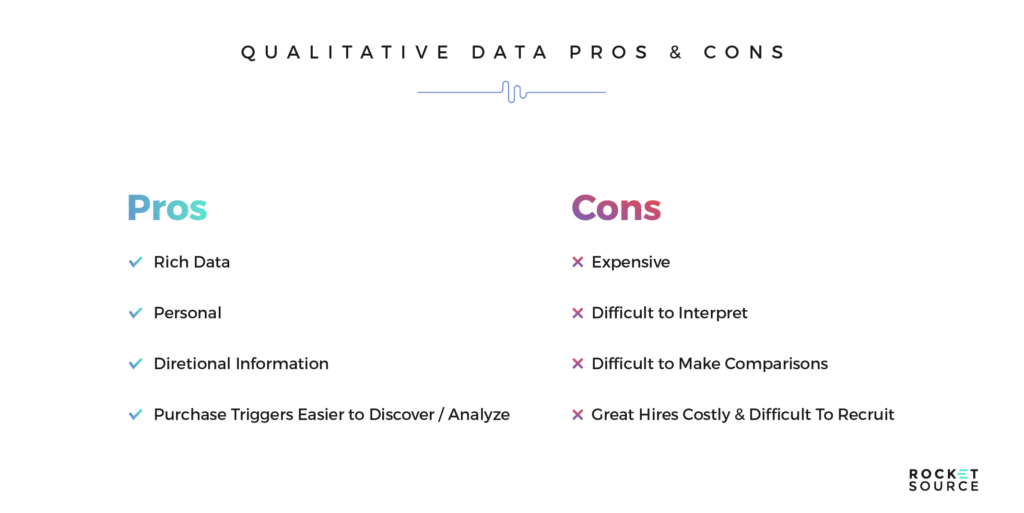
Quantitative Data is Best Used When Backed by Qualitative Data
Human motivation is better understood and interpreted through qualitative data. The struggle here is that qualitative data typically isn’t measured with numbers. It lives in things like Word documents, handwritten notes and verbal conversations.
Qualitative data is powerful, rich and full of profound insight for understanding your customer as a whole.
When striving to get more in-depth customer journey analytics, how do you quantify and measure opinions, nuances in word choice, and descriptions? You look at this unstructured data as a psychologist would. Buckley showcased a few ways to do this in his post about journey analytics. Here is another example — usability testing.
Usability Testing
Collecting data through usability testing involves standing over a person’s shoulder, figuratively or literally, and watching how he or she engages with whatever is in front of them. In some cases, researchers ask the subject to talk through his or her process and thoughts while interacting with the item or software in question. Other times they merely observe.
Marketers in all industries have used this approach to better understand what goes on during the purchase process. As a result, many companies have been able to grow revenues by watching what their buyers are doing. An example of one of those companies is Spark Experience. Here’s a video of Founder & CEO Spencer Gerrol talking about these tests:

In the video, Gerrol talks about how the company effectively measured the impact of advertisement placement in the popular game Angry Birds. They generated 7x more calls to attention of the ad, 3x the frequency of impressions, and 3x recall after the game was over. Why did they choose usability testing instead of asking a focus group or analyzing qualitative data? Because Gerrol thought like a psychologist, as he explains in the video:
“You have all of these biases, and with our research, we really need to remove that. We need to tap into … the brain and the nervous system and we’re actually able to quantify it and record people’s actual experience, not what they tell us, not what they think we want to hear. Emotion is entirely subconscious. You’re not aware of it, and the second you try to become aware of it, it starts to change and so we need to be able to measure it, and we need to measure it in real time to really understand it.”
Remember earlier when we mentioned that Buckley took cognitive science into account as he developed the StoryVesting framework? That concept can be seen here as Gerrol’s reference to cognitive biases people have when analyzing consumer behavior.
Quantifying qualitative data through methods such as usability testing keeps your data cleaner and more insightful, which serves to keep your biases out of the picture when analyzing your customer’s journey. You’re able to start seeing the emotional triggers that spark your buyer to take action. You can see the logical progression a buyer takes while navigating through his or her journey, and you can measure and begin to recognize how the blend of emotional and logical triggers impacts the experience as a whole.
Customer Journey Analytics Isn’t Just a Marketing Thing — It’s Critical Organization-Wide
The key to tapping into your customer journey analytics is to get these insights out of the marketing department where they’re typically isolated/secluded/siloed. Customer journey analytics must be an organization-wide endeavor.
You need data scientists who know how to apply data to your customer journey analytics framework. You need DevOps to understand how to implement necessary changes incrementally to drive the greatest, fastest results. Even human resources, a department whose efforts are purely internal-facing, needs customer journey insights to recruit the right people to answer the customer’s needs and see where the customer journey could be suffering due to a lack of internal morale or cohesion.
And you need designers to deploy modern customer journey visualization strategies as a means of democratizing analytics across the organization. It’s through this cross-organizational collaboration that you can effectively drop silo walls and gain more buy-in to refine your experience initiatives.
Drive Deeper Insights Through Your Customer Journey Analytics
Getting more in-depth insights into customer behavior is at the top of every marketer’s agenda. But these insights should not live exclusively in one department. They need to filter out organization-wide to upend the competition and push your business into the forefront.
By tapping into both qualitative and quantitative research, using the lens of the StoryVesting framework to analyze your customer data and bring everyone in your organization on board, you will build your competitive advantage. As you sharpen your customer journey analytics and refine how you view available information about your buyer’s experience with your business, you’ll have the fuel to grow and even to disrupt.
Want more information about how to bring better customer journey analytics to your organization via richer data and the StoryVesting framework? Our LevelNext MasterClass Workshops on Modern Business Transformation can help. Sign up for the complementary series, Digital Dominance, or learn more by clicking on the links below.
![]()
Kimberly Crossland works tirelessly to uncover innovative ways to improve the digital experience. Though her work is mostly geared toward content, she works closely with everyone on the RocketSource team to engineer growth and ignite results — and she does this daily with a strong cup of coffee in hand.
![]()
Julia Rakowski is a key member of the content and digital experience team at RocketSource, where she plays a critical role in inspiring and coordinating transformation initiatives. Julia empowers the team from start to finish in all branches from consulting and training, to products and the Labs division.
Customer journey analytics isn't just another buzzword. It's a critical part of any growth strategy. This post will help you learn how to draw powerful insights from your customer journey analytics using the StoryVesting framework as your guide.
Content and Digital Experience Manager
Content and Research | RocketSource