


The Indisputable Value of an Effective Qualitative Data Practice
Pablo Picasso famously said, “Colors, like features, follow the changes of the emotions.” Being able to master context and emotion is a necessary skill outside the world of art. In a business sense, qualitative data is the color that gets added to the black-and-white findings of quantitative data. Adding nuance, context, and emotion changes the story being told and the strategy that stems as a result of those richer insights. It’s crucial to add this context to your data, but without the qualitative data to do it properly, many teams default to creating context based on gut feelings rather than strategically reaching their market.
The challenge isn’t a lack of desire for this information. It’s a struggle to know where to collect qualitative data, how to collect it properly, and how to start sifting through what’s available. To dip their toe into qualitative insights, organizations conduct surveys following a transaction —or failed transaction— of a product, and call it good. That diluted approach causes them to miss out on a wealth of other underutilized sources, costing the organization more on the cost of acquisition (CAC), lower ROI on marketing spend, and fewer closed leads by the sales team.
In today’s often black-and-white world, it can be difficult to add color and truly understand the nuances of consumer behavior in a way that will boost the bottom line.
One person who quickly grew to understand the importance of insights derived from qualitative data was Steve Jobs. Still, his understanding only came after he repeatedly made a huge mistake — focusing on the product over the customer experience. This happens to be the same mistake many organizations, from large publicly traded companies to promising startups, continue to make today.
Qualitative data equips companies like Apple to marry experience and technology seamlessly with invisible marketing.
Steve Jobs was fortunate enough to have his biggest failures scrutinized — something many of us would be so lucky to have. However, Jobs’ biggest failure wasn’t as obvious as a failed product launch or broken service. It wasn’t even the many infamous and defunct cable adapters Apple released over the years or the lawsuit he rendered against Google for what he called “stolen software.” His biggest mistake was starting with the product before looking at the customer experience (CX). Take a listen to how he describes this critical mistake in his own words:
For years, Steve Jobs built up the scar tissue he referenced in the video above by ignoring the opportunity to know how to:
- Read between the lines of consumer behavior
- Understand what people want and how they operate
- Deliver a sublime product experience that’s hard to ignore or leave behind
Arguably, had he gone through collecting and analyzing qualitative data correctly and then linked it back to quantitative data, he might have been able to prevent Apple’s bankruptcy in 1997. Instead of a stream of failed product launches, he might have seen the iPhone overtake the Blackberry years earlier. And in his short life, he might have seen how much his innovations had already altered consumer behavior and lifestyles.
So what is it that he ultimately missed? And more importantly, how can you avoid making the same mistakes? In Jobs’ own words:
”Some people say give the customers what they want, but that’s not my approach. Our job is to figure out what they will want before they do.”
Jobs’ string of failures happened because he was listening to the market, but when he changed his tune, he changed the trajectory of Apple, making the brand one of the largest corporations in the world. Upon shifting to a more human-centric approach, Apple took off by developing such milestone products as the iMac, iPod, and iPhone. Knowing what would cause this explosion of growth went well beyond a simple survey, which admittedly is what many think of when they hear qualitative data. It required a full-fledged qualitative data practice, including:
- Text and image analysis
- Microevents
- Search and web behavior analysis
- Over-the-shoulder research
- App usage behavioral research
It’s not the team of data scientists crunching numbers in a basement at the Cupertino Campus that found these insights. It was the company as a whole that functions together as a singular team, blending UX/UI, hardware, app-development, microservices, and so much more that built a seamless product line and ecosystem. That team unification focused on experience over profits. Or, as Jobs put it:
”Being the richest man in the cemetery doesn’t matter to me. Going to bed at night saying we’ve done something wonderful, that’s what matters to me.”
Yet the reality for most enterprises is different, and that difference is not small. Instead of teams focused on creating gorgeously sticky customer experiences, they are focused on attribution for micro wins along the way. IT teams are focused on storing and securing data rather than making it ready for analysis. Sales teams often go rogue, taking matters into their own hands, leaving customer success teams to adjust agreements just to find a soft landing point after pulling back on an original promise.
It’s a mess out there, so we’re here to help you get back on track.
If you want to avoid the same mistakes Steve Jobs initially made, move towards having a collaborative team that works like Apple, and begin putting experience first —you’re in the right place. We will discuss what it looks like to have an effective qualitative data practice that gives you the insights needed to ready your team for action. Rather than encouraging constant competition for credit, or that coveted CEO circle, we will discuss how you can become an insights-driven company through the power of emerging technologies.
The Power of Qualitative Data for Modern Organizations
Before we get into how qualitative data works to bring the insights, let’s be sure we’re on the same page. Here’s how we define the term:
Qualitative data offers detailed insights into a buyer or employee’s emotional triggers, delivering an unparalleled depth and understanding of why someone behaves the way they do.
Too often, qualitative data is treated as an ad hoc practice. An enterprise will spend thousands of dollars on an agency to capture data through a one-time project, such as one big survey, one big research study, or one big focus group. After that one qualitative data gathering practice is done, it’ll take months to analyze and pull together a report on the findings. Then, once the report lands on your desk, it’s too late. The data is outdated and you’re working from lagging indicators rather than leading indicators of what the market wants.
Moving beyond the ad hoc approach can help teams gather data from a wider swatch of resources, and strategize based off of more real-time insights rather than outdated reports. There’s not a shortage of data sources to pull from either. Look at some ways we can deepen our approach beyond channel metrics, financial figures, or even one-off surveys.

As you can see, qualitative data extends well beyond a quick question-and-answer session or relying on buyer attributes alone to shape marketing campaigns, key business decisions, and product development. Surveys are only one way to gather qualitative data, but to get even more detail requires organizations to go deeper with case studies, boots-on-the-ground style observations, transcript reviews, and call center data—just to name a few. Understanding the business forces at play, and the emerging trends, and why consumers act a certain way , requires you to go beyond collecting data.
A strong qualitative data practice happens when you don’t just collect data but also activate your data to achieve a healthy return on your investment while simultaneously honoring the human side of the experience.
Going deeper requires a more mature approach to uncovering why someone acts the way they do and leveraging those insights to make critical business decisions about your organization’s next steps.

Most businesses stay stuck in the left column trying to figure out what’s continually blowing budgets, making a bunch of content with hopes something will stick. This spaghetti-on-the-wall style strategy wastes 50% of most marketing budgets by keeping 50% of the analysis in the dark. Rather than analyzing the ever-evolving market trends and business forces, such as new laws, regulations, changing customer sentiment, or the ups and downs of the economy, teams analyze channels. In doing so, there’s a high likelihood that they’ll cut a critical channel that might seem unimportant but actually influences the customer journey upstream. In this maturity model, you can see how much more depth is required beyond analyzing the marketplace and gathering a few answers to survey questions.
Channel marketing is an antiquated practice. The key to staying competitive and relevant is to stay ahead of the game and understand why things are unfolding the way they are. Instead, we like to move from traditional dashboards to a leadership dashboard that better informs us of what’s happening in the market.

In a leadership dashboard, teams can get a more informed sense of why things are happening. This in-depth dashboard still lets you know where your customers came from, but it also lets you know why they decided to buy, why they’re staying, why you’re experiencing churn, why they chose one product over the other, and more. Through pinpointing why someone makes certain choices, or has the mindset they do, you can better understand where to focus your attention. You can take the traditional, high-level marketing insights — and add crucial context to what’s happening in your buyer’s mind while they navigate the buying journey. Much like Steve Jobs discovered through his work, this context equips your teams to take a more predictive approach to your product development, marketing campaigns, retention strategies, and more.
Leveraging insights from qualitative and quantitative data looping allows organizations to reduce customer acquisition costs, increase lifetime value, and operate more efficiently.
By marrying the business insights to the consumer insights on a perpetual basis, you can drive perpetual product-market fit, speeding up your time to insights by spotting patterns faster and making more confident business decisions.
Quick shameless plug before we move on: If you’re interested in partnering with someone to do this, take a look at our methodology for how we establish perpetual Product-Market Fit for clients.
Customer Sentiment is in the Driver’s Seat
As you examine the macroeconomic backdrop today, it’s important to remember who’s really in charge—the customer. Customer sentiment drives both acquisition and retention, but outside business forces directly impact how customers think, feel, and buy today.
As evidence, look at what happened to Blockbuster. Had they partnered with Redbox, they might not have gone under. Similarly, if Redbox had partnered with Netflix, they might have been more formidable forces in today’s world. No matter how strong a company might seem, ignoring outside business forces could spell steep and swift declines in performance. In 2020, Netflix went from riding a fan favorite win to quickly getting canceled due to a release of certain content that many saw as inappropriate.

People generally go to streaming services to get a mixture of content. That was certainly true when the 2020 Covid pandemic kept people home, fearful, and bored. Instead of being able to socialize in person, many took to Netflix to binge popular shows such as Tiger King and Ozark.
That spike in subscribers caused Netflix’s growth to trend upward quickly. However, their seeming hockey stick growth chart quickly took a major dip when they added a controversial film, Cuties. Many consumers viewed this film as inappropriate. Almost overnight, sentiment toward the brand plummeted along with its subscriber base. #CancelNetflix trended on Twitter as parents and politicians demanded that Cuties be removed from Netflix. Ultimately, Netflix was able to bounce back, but not before a firestorm of emotions (combined with unprecedented levels of fear and uncertainty due to the quarantine) caused steep peaks and declines for the streaming service.
Neither Tiger King nor Cuties content was the sole cause to Netflix’s growth to surge or downfall. Given the macroeconomic backdrop at the time, other business forces were at play.
Thankfully, news moments won’t always be as big as this one, but many will have some sort of impact on your business.That’s because news moments are made up of many more individual human moments that influence how we connect, survive, thrive, and find purpose. These highs and lows are attached to the emotional state of the decision-makers.
Back to the pandemic, think about how the people on the other side of the screen felt when they chose to cancel their subscriptions or publicly share their opinions about the shows. Consumers were already living in a higher-than-usual state of fear. Pew Research found that 41% of U.S. adults experienced increased levels of psychological distress during the pandemic, and the Center for Disease Control found that 37% of U.S. high school students struggled with mental health. With lockdowns, uncertainty, and catastrophic personal events in many people’s lives, viewers took in all content through a uniquely fearful lens. Introducing new content designed to spark conversation without considering context caused the brand to ride a wild rollercoaster that year.
Knowing the context behind decision-making is critical across all industries, not just those involved in entertainment. As mentioned earlier, all industries have emotions attached to the purchase decision—including those industries consumers engage with multiple times every day, specifically food.
Despite lockdowns, people still had to feed their families. This basic human need isn’t as simple as eating rice and beans everyday. The choice of what to eat was directly impacted by what was happening in the world in 2020. To see how, let’s look at a few food groups directly impacted by behaviors that stemmed from the pandemic—first, the pizza industry.

Pandemic or not, when consumers hear the word pizza, they typically think of delivery. When the shutdown happened in early 2020, many people turned to pizza delivery services to put food on their tables because that was the first food they thought of as an option for safe, contact-less delivery. Papa John’s same-store sales increased by 17.6% across North America, according to QSR Magazine. Domino’s domestic fiscal sales rose 11.5% in 2020. The New York Times deemed pizza delivery to be the restaurant hero of 2020.
Many consumers were also spending time at home making sourdough starters. Those sourdough starters often turned into pizza crusts, sparking a new wave of growth for a particular business — Ooni. Ooni pizza ovens exploded sales by over 300% in 2020 because more consumers’ attention was drawn to home-baked foods than before.
Attention is currency in today’s world, yet it’s not just closely linked associations in a person’s mind that can inspire them to take action in one direction or another. Distant connections can also steer consumer behaviors in one direction or another. Case in point: Texas pride.

In 1986, the Texas Department of Transportation looked at their budget and noticed that they were spending a whopping $20 million dollars annually on litter cleanup. Desperate to save money and to save their state from the environmental impacts of litter, the Texas Department of Transportation hired an Austin-based advertising agency, GSD&M, to come up with a new slogan. After batting around several slogans with the word “litter” in it, they realized none of those would make a deep enough impression on their target audience of 16 to 34 year old men — the group that a California research agency found to be the biggest culprits of littering at the time.
While out for a walk one day, one of the advertisers on the project saw some litter and thought, “This is a mess.” He instantly connected that phrasing to the root emotion of pride that was instilled in him, and countless other Texans, from birth. You treat your area with pride. Instead of focusing on the term “litter,” they chose to associate trash pickup with “messes.” With that, the “Don’t mess with Texas” slogan was born.
Rather than immediately associate the new slogan with an anti-littering campaign from the Texas Department of Transportation, the team decided to infuse this concept in their target market’s mind around the emotion of pride. They splashed the slogan everywhere without sharing the meaning behind the phrase, getting it into the public’s consciousness faster. It quickly became a battle cry among Texas residents. During the Cotton Bowl on New Year’s Day, the advertising agency connected that slogan with the expense and illegality of littering via a strategic commercial starring Texas musician, Stevie Ray Vaughn.
Over the course of the year, Texans took this message to heart. Research showed a 29% decrease in litter on the road in the first year, and a 70% decrease in four years since the launch of the campaign. In 2002, the Texas Department of Transportation trademarked the phrase, owning the battle cry of Texans and solidifying the need to keep the Lone Star state clean.
Getting messages for your campaign almost right is good, but hitting the nail on the head is where the cream rises to the top and real ROI is seen. Resonating with the target market’s why can equate to a tremendous shift in behavior, such as that reduction in litter on the Texas streets. As seen above, customers weren’t interested in “not littering.” They were prideful about their state. That pride is what got the attention of Texans and inspired a mass shift in behavior by associating pride with anti-litter.
There’s unprecedented competition for a share of attention that extends beyond industry alone. Organizations need to know how to capture that attention by going deep into the qualitative data available and finding those cognitive associations to their industry and brand. Maneuvering the inner workings of the human brain using guesswork just won’t cut it.
No amount of guesswork will ever replace the profitability of a strategic framework.
You’re up against a lot when trying to figure out what that right why looks like for your organization. The process must be methodical and strategic. It’s not something you can accidentally fall into. Even some of the best researchers on the planet will get it wrong if they’re not asking the right questions. And that’s the challenge many companies face when working with big consultancies — they ask what people care about rather than asking what makes them take action.
Awareness is not the same as action.
To keep the pizza analogy going, consider this. You likely know exactly where a Chuck E Cheese is in your city but when was the last time you went there for pizza? Being aware of a business doesn’t mean the customer will buy. The need for a product or service originates at a triggering moment, and it’s only when we understand what that trigger is and how people are making decisions that we can build a business.
Marketing Through Osmosis Simply Does Not Work
As a modern organization, your team benefits from taking all of the insights you’re gathering around customer sentiment and from other qualitative data sources. Still, it’s not enough to gather the data. You must also extract insights to find the exact trigger moment that’ll surge your sales. Until recently, this has been a manual effort by teams and outside agencies. Now, with emerging technologies taking the helm, organizations can avoid trying to absorb insights by slowly combing through data and instead feed those data sources into Large Language Models (LLMs) to get out ahead of trends faster. These LLMs, privately built out for organizations, are how we tap into generative artificial intelligence (AI) — not in the way you often see splashed around headlines today.
Using AI extends well beyond leaning on ChatGPT for content ideas. Instead, teams from marketing, sales, and customer experience can tap into machine learning to better understand what the market wants, demands, and needs. By having a private LLM where you can train AI on the qualitative data you’re gathering (or should be gathering), your team is empowered to get deeper inside the most complicated algorithm — the one inside your prospect’s head.
Flashing your product at the market won’t work. It’s flashing a benefit that triggers your customers to take action that will skyrocket the ROI of your campaigns.
Broadcasting the features of your products won’t matter if the benefits you’re marketing don’t align with your customers’ needs. Finding those emotional triggers that align with what’s happening inside the customer’s mind requires qualitative data. Without it, your marketing will fall flat. Your sales messages will fall flat.
Consider solar energy as an example of the importance of gathering qualitative data to capture the attention of your market.
Solar energy offers many benefits, but you must know the right benefits to flash in front of your customer if you want to get their attention. If you’re talking to someone who voted for Al Gore in the 2000 election and believes in climate change’s importance, you’ll likely capture their attention by saying that solar energy is good for the environment. However, if you share that same message with someone who is on the far-right political spectrum and doesn’t believe in climate change, your sales team will likely be told to take a hike. Instead, through sentiment mining, you can uncover a different why. By approaching that conservative consumer with a message about how solar lets you take back your power from the government and set yourself up to live off the grid, you’ll have a better chance of getting their attention.
People build their identities through the products they consume.
ROI in campaigns stems from relevance. Staying relevant requires organizations to know the consumer’s wants, needs, and desires. It requires organizations to know how their customer sees themselves and where they want to go. When consumers can feel like they’re part of something bigger than themselves, they’re more inclined to buy. The wrong triggers won’t even light a spark, whereas the right triggers will ignite sales. It’s this explosion that’s the result of gathering richer qualitative data insights through qualitative/quantitative data looping by understanding how specific populations of consumers within the overall market are behaving.
Extracting Action-Inspiring Insights via Qualitative Data
Collecting qualitative data is one thing. Taking action on the insights you glean from qualitative data is what will get your organization the ROI it needs. It’s about so much more than simply capturing attention. It’s about using that attention to inspire consumers to take action.
A good example of this comes from the book How Brands Grow: What Marketers Don’t Know by Byron Sharp. In it, Sharp talks about how difficult it can be to get a consumer to switch to another brand in certain markets. The cellular phone service market is a prime example of this. Switching is often so difficult that unless the customer’s current provider messes up significantly, it’ll be hard to tempt that person to go to a competitor. Studies show that factors, such as price (71%), battery life (68%), fast connection speeds (63%), and operating system (57%) are the top factors that drive customers to switch from one cellular company to another. Still, companies offer free phones, pizzas, or movies to get those people to switch. Through qualitative data insights, you can see that the freebies aren’t the triggers that will inspire the consumer to take action. It’s pain points, such as tight budgets, frustrating battery life, poor signals when needed, and an operating system that doesn’t align with personal preference.
The challenge for marketers is that you won’t really understand those pain points until you’ve taken the time to walk a mile in their shoes and empathize with them.

Here, you’ll see the empathy map we use at RocketSource to go deeper into customer behaviors so we can blend those behavioral insights into the organization’s messaging, sales strategies, and more. On the right, you’ll see the customer’s empathy map, where we tap into qualitative data to understand what the buyer is thinking, feeling, saying, and doing at every step of their journey. On the left, we can blend that into the employee’s journey to merge the customer and employee experiences. In doing so, teams feel better equipped to spur the customer into action by getting more aligned with their specific pain points.These thoughts, feelings, actions, and words all lead to the customer’s core desires. It’s these core desires that uncover the triggers the market can grasp. They allow teams to align their messaging with the consumer base’s core beliefs and values and map the marketing language back to the buyer, showing them how they can survive and thrive through their products.
Look at how Apple developed the marketing messaging around the iPod as a prime example.

By walking a mile in their customers’ proverbial shoes, Apple marketers were able to spot a significant pain point in the mp3 player industry. Customers didn’t care about gigabytes. Although that terminology was prolific in selling MP3 players, customers couldn’t correlate gigabytes with the number of songs. So, Apple simplified their messaging by saying, “1,000 songs in your pocket.” Now, the customer could feel the weight lifted off their shoulders. They didn’t have to carry around 15 different CDs to listen to their top 15 favorite songs. It could all fit inside their pocket with a custom playlist.
Qualitative data gives you the insights needed to find your unique selling point. Understanding how to compete for mindshare when you need their attention the most means capturing attention when your customer’s distracted by dozens of other thoughts, feelings, and noise, pulling their mind away from your brand or offer. Apple could cut through the noise of their customer’s minds by speaking their language and clarifying their offer. That 1000 songs in your pocket messaging and ease of understanding led the iPod to become the “gadget of the 21st century” and turn the company around from looming bankruptcy.
Where attention goes, money follows.
To stand out, you must offer something compelling that will stop their scroll, stop their steps, and start getting them to notice your brand.
Until now, we’ve focused primarily on digital marketing. The reality is qualitative data isn’t exclusively about the digital experience. The retail environment and traditional marketing channels can be optimized for marketing promotions, product placement, and sales with qualitative insights too. A good example of this in practice is how IKEA lays out their store.
If you’ve ever been inside an IKEA, you’ve likely noticed its layout is slightly different than most. The most common store layouts line products up in a grid, lay out the path like a racetrack, scatter products around, or lead customers through a spine of shelves.

The intent is to give customers ample room to explore and find their needs. It sounds logical, but studies show that these layouts only let customers see about 33% of what the store has to offer, making it harder for them to find what they want and need.
Inside an Ikea store, customers are kept on a fixed pathway. Once a customer enters the maze, they’re no longer left to their own devices. Instead, they’re being taken on a journey from one area of a house to another. The maze isn’t marked, either. Approximately every 50 feet, customers are met with something new, causing intrigue to see what’s waiting for them around the corner. Because customers don’t want to backtrack, they’re more inclined to put an item they’re debating on into their cart, rather than having to come back for it at the end of their shopping trip.
However, one of the most compelling parts of the Ikea store layout isn’t the displays. It’s their food court. When asked why there’s a food court in the middle of a home store, Ikea’s founder, Ingvar Kamprad, said in 1958, “It’s difficult to do business with someone on an empty stomach.” That logic seems to have held over time. Researchers determined that shoppers who ate inside of Ikea’s food court were twice as likely to spend money on home furnishings than those who did not.
It’s not enough to know that people aren’t taking action, whether that action is spending money inside your store, or clicking on your services page. Every shopping experience is a giant sandbox. Leveraging qualitative data to design a customer journey that tugs on your customer’s emotions to get their attention enables your organization to cut through the noise faster.
Becoming an Insights-Centric Organization Requires Quantitative and Qualitative Data Practices
The term “insights” gets bandied about often in today’s business world — so often that the meaning has been diluted. Insights are not metrics or statistics. Insights are a piece of human truth that unlocks our ability to cater to their needs as influence practitioners. Without understanding what’s needed to thrive or survive, it’s nearly impossible to promise how to survive or thrive with a specific product or service.
The ability to align a business insight with a consumer insight empowers an organization to keep moving up the S Curve of Business. Many forces are at play in your customer’s lives beyond your brand. Because of all the forces outside your organization, you must gather qualitative data beyond your survey results. Trends. Emotions. Iterations. Inventions. New entrants and threats in the market. Each of these is intelligence data that can be gathered and poured into a qualitative/quantitative loop to understand the statistical significance of the new information coming your way. In having this consistent data loop working in your favor, you can avoid unwelcome surprises and stay ahead of changing trends that will impact your buyer’s decision across every stage of the customer journey.
The S Curve of Growth represents the growth of an organization as new variables enter the equation, but even the S Curve of Growth has limitations. Many assume it’ll tell you if you’re moving up or down, whether to innovate or iterate, and whether you’re at risk of becoming obsolete. While insights are baked into the answers, the S Curve of Growth equation falls short because it doesn’t explain why or how you got to that point. Equations like the above don’t honor how the human brain calculates things like risk, opportunity, competitive advantage, or Product-Market Fit. By thinking this linearly about growth, teams get caught in a common trap of assuming that the S Curve is more of a natural motion. Employees assume that certain elements ebb and flow, so the curve will organically follow, but consumer behavior isn’t quite that straightforward.
The assumption that dips in growth are guaranteed to turn around and trend upward again causes many organizations to lose sight of critical data points.
Critical data points, including quantitative and qualitative data, signal whether the organization is going through a seasonal dip in sales or is on the brink of a major trend that could have a long-term impact. While some upticks in growth might have to do with innovations or iterations, other upticks or downward trends have to do with other business forces. If you’re looking at Netflix, you might see the stock ticker go up and down based on news or innovation moments. If you’re looking at Meta, you might see the stock ticker go up and down based on technological advancements. Still, if you’re looking at Tesla, you might see the same stock ticker go up and down based on sentiment around Elon Musk.
It’s important to understand what causes growth switchbacks. Trying to make critical business decisions based on NPS scores or exit interviews doesn’t honor how the human brain calculates things like risk, opportunity, or all the many variables that go into decision-making. The challenge today is that often, the picture teams are pulling insights from is broken.
Businesses fail because they lose the ability to connect with their consumers.
The biggest barrier to becoming insights-centric is that many organizations don’t have a robust enough quantitative and qualitative data practice to get it right. Often, teams don’t understand how to capture that data or what data they need to get deeper insights.
Quantitative Data Warning Signs
Quantitative data is essential to a proper qualitative data practice. Numbers and pattern shifts signal when things are going awry. Still, quantitative data alone cannot put color into the picture to tell us why something is happening.
Take a fun example of this in action by looking at how people eat cereal. Informal studies have found that 68% of people drink milk after eating it. That number is compelling, but not quite as compelling as why they eat that cereal. Did they see their parents do it, so they mimicked the behavior? Is it in their nature not to waste the milk when it is done? Are there any household factors more likely to correlate to their propensity to drink the milk? Could it be a variety of reasons within that 68%?
While this study doesn’t matter much in the grand scheme of things, it paints a picture of how little one quantitative figure actually shows. Still, organizations rarely start by collecting qualitative data. Typically, it’s quantitative insights that give us the indication that something is going on and requires deeper analysis via qualitative data. If an organization sees that CAC is going on while LTV is going down, you’ll take those quantitative figures and dig deeper into why via the qualitative data available.
Answering the question of why something happened is paramount when diagnosing growth concerns.
Knowing why someone filled out the contact form, turned from a cold to a warm lead, or bought now instead of months later allows you to understand growth opportunities and risks better. In doing so, you shift focus to the elements that impact systemic success instead of myopic things that don’t move the needle.
To show what this looks like when the scenario does matter, look at this data we pulled for an industry where we noticed the cost of acquisition (CAC) dropping by 40%.

If this quantitative data popped up in your board room, how would you approach it? Would you be able to understand where, when, and why you should spend more money? Could you pinpoint where the revenue problems and opportunities existed? Can you see the outside business forces that could be impacting these spikes and dips?
By looking at what was happening in the market, we want to know why something is happening. We linked the quantitative and qualitative data together and were able to answer why these changes were unfolding the way they were. From there, we saw the opportunity to update their strategy around what the market was really thinking, feeling, saying, and doing.
We then synthesized this data, cleansed the insights, and then pulled them together into a single data store. In doing so, we found that new laws in the area were prompting more sales in this client’s industry.

When looking at why CAC would drop when certain news pieces or world events occurred, we noticed that their CAC was so volatile because they weren’t addressing the overarching underlying reason people purchased their coverage in the first place. Rather than thinking they were driven by an interest in their industry, their qualitative data uncovered that there was an emotional trigger that caused their customers to buy—fear.
Qualitative insights pull out the human experience.
In finding those human elements, the client was able to adjust their marketing, better align their experience management (XM) initiatives, and ultimately move products faster as a result of taking the quantitative data signals and addressing the why behind those shifts via qualitative data, they’re now benefiting from increased retention and reduced CAC.
But let’s face it — knowing what’s happening with your customer is becoming increasingly difficult. With more data restrictions, organizations are no longer getting the layup from platforms to know who’s warm, interested, or has high purchase intent. Look at what’s happening with cookies as a prime example. Organizations operating in the EU are only allowed to track user data if they consent to have a small text file or cookie placed on their devices to store data and track online activity. Their consent happens when they accept cookies via a pop-up that will appear on the scrolling page. Here’s an example of what that looks like on CNN’s website.
If the user does not select “Accept All,” the organization is left looking at quantitative data trends but unable to dig deeper below the surface to see the user’s behavior on your site. These limitations look like a decline in activity when, in actuality, the user declines cookie acceptance.
If you’ve noticed this same trend, the problem isn’t that users aren’t taking action. The problem isn’t solved by trusting that action is being taken despite the user not accepting cookies and then operating on an assumption. Getting to the root of what’s happening requires you to marry your systems and look at what’s happening across your ads, customer relationship management tools, and other data points within your business. Done manually, that process can be a heavy lift. Giving your team the tools to connect the dots between data sources can help them better understand what’s happening, even amid data restrictions like cookie consent.
Categorizing the Responses
The big challenge with qualitative data has always been it’s just that — it’s not quantified. It’s difficult to glance at a large data set and pull out patterns. Because there’s so much nuance to the data, it’s hard to attach black-and-white numbers to the data. You can’t fit the findings into a single slide in the deck you’re sending to the C-Suite quite as neatly as you can: conversion rates, costs of acquisition, or churn metrics. The big elephant in the room is:
How do you attach black-and-white numbers to nuanced emotions, situational context, and cognitive associations?
Structuring data has tremendous value. It helps teams understand whether the insights they’re gleaning have statistical significance. You can evaluate where you are and monitor progress as you make strategic shifts. And you can pinpoint warning signs to know where to peel back the layers further to understand what’s really happening.
One company that was able to take those quantitative warning signs and adjust accordingly was Old Spice.

Old Spice, the body care brand for men, has been around since 1938. Initially, the brand did well among its buyers, but as that population aged, the brand started struggling to capture market share. Early quantitative warning signs signaled to marketers and sales teams that the brand needed to shift its appearance if it was going to grow among its emerging competitors Right Guard and Axe.
Looking closer, the company realized that they needed to rebrand from being the deodorant for parents and grandparents, and get into the hearts and minds of 12 -34 year olds. Until that point, Old Spice had been focused on messages regarding quality — a characteristic that older generations appreciated. However, younger generations who were turning toward competitors Right Guard and Axe cared about something very different. They cared about manliness, sex appeal, and adventure. Those characteristics inspired Old Spice to rebrand to save their sales trajectory using a “Swagger” campaign.
You’ll notice something about this campaign — it isn’t talking specifically to men. Instead, Old Spice understood that women bought the bulk of men’s body products, so they positioned the ad to honor the emotional attributes of men while speaking to women, who marketing firmWieden + Kennedy at the heart of the Old Spice campaign, determined were the purchasers of men’s deodorant 60% of the time. Through this campaign, Old Spice successfully positioned itself in the market quadrupling their sales in the first year. In addition, they saw 5.9 million YouTube views on Day 1, 40 million YouTube views in one week, 400% increase in traffic on OldSpice.com, and a 125% increase in sales.
Getting to this depth of insight goes well beyond attaching a number to verbal responses. You have to understand why loyal customers choose to stay versus switch to a competitor. It took a lot for young men to switch to what was perceived as their parents and grandparent’s brand. Old Spice had to shift the market’s cognitive associations of the brand to avoid losing market share, and fast.
Reaching that level of analysis faster and more accurately doesn’t happen by chance. It happens when the quantitative indicators and qualitative data at hand is categorized correctly.
There are a variety of ways that qualitative data can be categorized and quantified.

Many organizations stop at binary categories when considering TAM and target cohorts. When looking at qualitative data, they categorize the respondents into mutually exclusive parameters, such as Republican vs. Democrat, truck vs. minivan vs. car owner, or attributes such as tall vs. short. Other times, teams will categorize data ordinally, meaning in a specific order. For example, best vs. worst, five-star reviews vs. one-star reviews, or anything that runs from big to small or top to bottom.
While there are clear reasons to categorize groups based on these binary components, there are also many other ways to categorize respondents and the answers they provide. With qualitative data analysis, we like to leverage nominal data. Nominal data can be classified and labeled into multiple categories without numbers and in various ways. For example, if you’re looking at minivan owners, you cannot focus exclusively on easily quantifiable data, such as cost, make, model, color of vehicle, or features alone. Some minivan drivers might love their vehicle because of the family life it symbolizes for them. There could be nostalgia for owning a minivan. Or, there could be frustration because they would prefer to drive a Ferrari but don’t have that option in their current season of life. By categorizing feature sets over emotional drivers of owning the vehicle, you lose a lot of understanding about why your customers make their choices. That lost insight directly impacts your team’s ability to drive ROI from marketing campaigns and sales conversations.
Target markets are diverse and largely filled with emotion. By graduating away from generic assumptions and stereotypical personas, teams can leverage qualitative data to unite around a handful of central ideas spanning various personas. This categorical shift allows your team to deepen their approach to product development and marketing strategies by focusing more on the TAM. Donald Miller, author of Building a Storybrand, said it best when he said:
”People’s internal desire to resolve a frustration is a greater motivator than their desire to solve an external problem.”
Unfortunately, knowing how to articulate those frustrations to people isn’t simple. Let’s take, for example, the innocent scenario of a parent deciding what type of cereal to buy their child.

In this image, one parent chooses Cheerios while the other chooses Frosted Flakes. Both parents are driven by being good parents, yet both parents seek something different. The Cheerios parent wants their children to be healthy and active, while the Frosted Flake parent wants their children to be full and focused. This shift in focus on what they seek leads them to look at different benefits of the product. Cheerios will support their child’s nutritional needs, while Frosted Flakes will support the emotional stability of an already chaotic morning with less fighting over what to eat. The same is true for the product attributes itself. The Cheerios parent looks for healthy, low-sugar options, while the Frosted Flake parent looks for a taste their child will love.
Categorizing sales of each cereal type alone wouldn’t help you understand these emotional threads. By categorizing qualitative insights, you can spot patterns across various data sources and better understand the common threads and subtle differences that can steer marketing campaigns.
Paying attention to the things that threaten the status quo, such as being a good parent or not, goes beyond philosophical and physical threats. It’s about challenging a worldview.
By categorizing your qualitative data, you can understand why your TAM experiences the fear they do. Every person has a different trigger, but identifying the common thread through the same product benefits can help steer critical decision-making. In the past, we were left to do that manually. Now, with the advancements of emerging technologies, we’re able to speed up our time to insight.
Understanding Purchase Intent Via Behavioral Economics
A famous 2006 study among medical staff found that when being observed, the staff practiced compliant hand-washing tactics 55% more than when they were not being observed. In other words, they behaved differently when they knew they were under the microscope than when they thought no one was looking. This is known as the Hawthorne Effect.
The Hawthorne effect occurs when people behave differently under observation than they do behind closed doors.
As influence practitioners, understanding this cognitive bias is important as you collect qualitative data. The way a user portrays themself to the world is often different from how they act when they think no one is watching. Therefore, asking a user what they plan to do via a survey will likely get you a different response than the actions they plan to take. While listening to what a person says, it’s equally important to watch what that person does. By analyzing the gap between outward expression and action, you can better understand the emotional reasons that supersede the logical decision-making factors that go into purchase intent.
When analyzing the intent behind a purchase, it’s important that behaviors and qualitative data are not taken at the surface level. To paint a picture of why, let’s look at impulse buys. Let’s look at the candy placed in the checkout section.

Candy is one of the most common impulse buys in the grocery store, and for good reason. It’s placed strategically where consumers are most likely to reach for it. Studies have found that impulse buys in the checkout area account for $6 billion in impulse shopping. Some believe that candy and treats are placed at checkout because that’s where they’re most likely to be seen. While that’s true, there’s more to this story. Putting small ticket items that are notoriously impulse purchases at checkout means you’re positioning those treats in front of the customer at a time when they have reached decision fatigue. They’ve been up and down the aisles. Now, they’re no longer mentally overthinking everything in their cart. For some customers, that means not telling their child no to yet another treat. For others, it means not telling themselves no to another treat. Regardless of who’s feeling the impulse for something unhealthy, placing the candy at the end of the shopping experience intentionally capitalizes on this decision fatigue.
There are plenty of other industries that benefit from this same emotional response. Supplements capitalize on their user’s desire to look better. Finding a new customer relationship management stems from having a boss unhappy with the team member’s performance.
Looking at behaviors two-dimensionally often leads to predictions that ultimately don’t align with reality.
Everything we do with our marketing impacts the audience on an emotional level. How the sales team speaks to potential leads impacts the likelihood of them buying. Everything we do impacts audience perception. Sure, sometimes it’s the product that’s missing features or isn’t the right fit, but other times, the verbiage used to speak about your offer, where you place your offer, and how you position your offer impacts the sale.
Rather than getting buried inside qualitative data without context, it’s important to know what inspires those emotional triggers in buyers and what gets them to take action, even subconsciously. Through understanding, connecting, and empathizing, we can embed a solution and resolve that stress for customers and employees. That process requires us to check past our own assumptions. Through this process, you can start to see the consistencies and rationale behind every purchase decision — and that’s when your teams can start to realize the true ROI of a strong qualitative data practice.
Collecting Qualitative Data to Extract Meaningful Insights
Everyone we talk to wants to dip their toe in this information and new technology, yet few organizations know where or how to start with a qualitative data practice. That’s because this approach is so challenging because many enterprises look at qualitative data and assume it’s just a revolving door of insights that will consistently shift based on the macroeconomic backdrop. However, the cost of not understanding external market data, business forces, and internal team morale is high and directly impacts the bottom line.
To make a real difference on your bottom line, you must go deeper than answering a couple of questions with qualitative data.
Leveraging qualitative data attributes allows you to understand your content better and your audience better.
Having a content data warehouse will give you the holy grail for marketing. By understanding these attributes and changing your audience’s behavior, you can understand their propensity to buy.
You need many data points, but how do you get started beyond the high-level surveys organizations typically use? How do you back qualitative data into a strategic framework to get your total addressable market to take action with you over the competition? And how do you leverage generative AI for your organization with private large language models (LLM) for more accurate sentiment analysis? We will answer all of these questions, but first, let’s expose the dangers and possible missteps associated with a lack of proper context when gathering qualitative data analytics.
Focus on Context When Gathering Qualitative Data
Before any data point is poured over or loaded into an LLM, you must ensure that you’re adhering to the rule of dirty data in, dirty data out. This rule deems that data needs to be clean when you feed data into a machine learning model or algorithm. If it’s not, your output will be tainted and inaccurate, sending you in the wrong direction strategically.
Strategic data collection is paramount. Getting the most accurate and clean responses requires teams to understand the exact point in the maturity model where the data is being collected. By not asking the right questions with appropriate quantitative data, it’s very easy to go after the wrong qualitative data points.
The wrong questions lead to qualitative data that doesn’t provide statistically significant actionable insights.
Relevance is key in knowing when and how to ask your market questions. It’s an art and science to lead your respondents to share what you want and need to hear. Still, many enterprises tend to go after convenience sampling or, worse yet, purchase data, stripping away the context needed to weigh the data during analysis properly. Context that speaks to your buyers’ core values driving the decision-making process. Context that speaks to the root emotions that trigger the initial search. The context lets you peer further inside what’s happening in your buyer’s life and the no-brainer areas your organization fits into their mix. That lack of context leaves you guessing about what the customer was truly experiencing when they answered. For example, how can you truly understand why a person answers 8 instead of 9 on an NPS survey without knowing what happened before, during, and after their experience?
When it comes to gathering qualitative data, context is what will move you deeper into the insights maturation matrix.

The insights maturation matrix showcases how much deeper organizations can go as they mature in their qualitative data collection practices. So often, teams want answers to questions about what is happening. When they see what’s going on in the market, they start creating new products and services or launching into new channels. Rather than simply understanding what happened and where, teams mature when they can also see the actions taken (when/how), why those actions were taken, and the cognitive process that triggered the reaction it did.
To show how mature qualitative data can add color and context, take the analysis of a marketing campaign as a prime example. During the analysis, the team might notice that their conversion rate was 1% and think that’s an outstanding conversion rate. However, while some celebrate the win, others might flip that conversion rate on its head and think, “Why did we lose 99% of the people who saw the campaign?”
Put differently, consider this:
A lot of businesses look at their content and wonder what the customer doesn’t understand about their offer, but the real question we need to ask is, “What are we not understanding about our customer?”
Unpacking why something happens is how enterprises mature in their growth, answering questions such as:
- What does my audience feel when they land on this page?
- How did they come to find this page?
- Were they confused?
- Did we do a good enough job of anticipating their needs?
Following the insights maturation matrix, the team can boost the ROI of a marketing campaign by changing the baseline from a 1% conversion rate to a 20% conversion rate. Rather than celebrating what happened, the team can peel back the layers to see what was happening on a bigger scale when the purchase occurred, why the customer was triggered to look at or ignore the campaign, and the cognitive associations behind the campaign.
Adding context behind your qualitative data allows you to determine where the misalignment is between your customer’s actual mindset and your understanding of it. By looking at why people react the way they do, teams are better equipped to find innovative ways to resolve cognitive dissonance. Context in survey questioning and analysis can only take you so far. Being able to pull out statistically significant responses requires you to sift through large amounts of data, which requires that your findings get put into categories to help you unpack the nuanced data at your fingertips.
Surveys Alone Aren’t Enough for Qualitative Data Analysis
When you say “qualitative data analysis” to most people, surveys come to mind. Many people we talk to believe that qualitative data is simply another term for survey results. While we understand where that misconception stems from, it couldn’t be further from the truth. After all, if you want someone’s opinion, it just makes sense to ask for it, right? Not quite.
Surveys are Inherently Biased
Surveys are undoubtedly one of the more biased forms of qualitative data collection. In some cases, bias is automatically introduced when a respondent is presented with an opportunity to share their opinion because they worry about how their answers will make them look. If you change things around and offer a multiple-choice format, you won’t get the depth of answer you need either. That’s because roughly 90% of what people are actually thinking or feeling won’t come through because of the given answers. They are only there to confirm the surveyor’s own bias.
This tendency for respondents to bend their answers, leading to inaccurate insights, often stems from something called Target Chuting. Target chuting occurs when a surveyor asks an open-ended question, driving respondents to be less decisive and closed off to what they’re feeling in their subconscious. The way a surveyor presents a question confirms and enhances the bias in the respondent’s mind.

As you can see above, the question’s wording is critically important when trying to extract accurate insights. For example, a research study presented in one of my favorite books, Pre-Suasion by Robert Caldini, found that biased responses occurred when unbalanced questions were asked. In this study, surveyors asked respondents if they were happy or unhappy with their social lives. Researchers phrased a general question to two separate study groups. In one, they asked, “Are you happy or unhappy with your life?” In this group, respondents generally answered relatively favorably. However, when respondents were asked, “Are you unhappy with your life?” they were 375% more likely to respond with dissatisfaction, declaring themselves unhappy.
While restricting options speeds the respondent’s time to answer the question, it also blows past the deep-seated fears in our respondents’ replies. Rather than understanding more about why someone felt happy or unhappy, respondents were funneled toward a certain response, whether it was true or not.
Surveys aren’t the only culprit for misguided answers, though. Gathering freeform responses through things like focus groups can skew results, too. When you gather people in a room and get them talking, you’ll consistently run into the problem of having a few loud voices drown everyone else out. Without having a highly emotionally intelligent and empathetic person leading the discussion, you’ll have to read between the lines to extract answers from the more shy respondents, which isn’t an effective way to run qualitative data analysis.
Surveys Can Send Teams in the Wrong Direction — and Fast
Sifting through lengthy, dense responses takes a lot of work. It also requires human interpretation, which has the potential to go wrong and go wrong fast. That incorrect analysis on an ad hoc basis sends teams chasing inaccurate responses and trying to figure out why the data doesn’t add up. Something that happened today isn’t the same reason that it will happen tomorrow, next month, or next year. It’s not the same reason it could happen in one part of the store versus across the parking lot. Time and space proximity matter in survey responses, and without that context, your team could draw inaccurate insights from the data gathered.
Take our experience gathering boots-on-the-ground style data for a Fortune 50 enterprise client.
In this example, we were brought on by an organization’s team to help them increase sales of add-on services to their membership. These services were presented at a specific spot in the buyer’s journey through their brick-and-mortar store. The team initially thought that presenting these services at the end of the buying experience would keep the services top of mind for when the consumer had a need later on. To determine whether that was true, we went to one of these brick-and-mortar locations and stood at various points, asking if the consumers knew the services were available.
The first place we stood was right after the customer left the store and had just been presented with the services moments earlier. Then, we moved to the back of the parking lot and met consumers at a different point in their journey. Further out, we still met consumers in a competitor’s parking lot across town to see if they knew about our client’s services. The further away we got, the less a buyer knew the services were available. More intriguingly, the respondents tended to offer more honest reactions to the brand in a third-party location than in their storefront or parking lot. While the client assumed that the presentation point of those services was ideal based on ad hoc analysis, our contextual approach to qualitative data gathering determined otherwise. Presenting something new in a chaotic point in the customer’s journey lowered recall rate and conversions. Going beyond basic survey results allowed us to shift their strategy and tap further into the emotional and logical elements of this offering.
When an organization engages in a Big 5 consultancy, it often hopes to commence a survey to gather qualitative data. Yet, as you can see, survey results alone can be potentially biased based on location and distorted based on when the questions are asked in the respondent’s journey.
Qualitative Data Lets You Discover Your Total Addressable Market
Without question, the Timex ads are some of the best advertisements of all time. If you’ve seen them, I’m willing to wager a bet that you never forgot the signature phrase, “Takes a licking and keeps on ticking.” Here’s one of our favorites.
Timex watches became iconic because they told a story that resonated well beyond the circular face, numbers, and moving hands. Rather than barraging magazine readers or television viewers with information, hoping that one of the features would stick out to them, they addressed their market with something deeper — longevity that inspired brand trust.
Instead of poignant messaging that addresses all potential customers in one fell swoop, organizations limit their approach to persona-based marketing.
When limiting the view of the market, organizations end up talking to their customers instead of talking with them. Yet it’s a conversational approach that hits to the core of everyone’s wants and needs, stirring up a complex emotional schema of desires, hopes, and fears. To get in front of a wider group of people without diluting the messaging means we need to know which messages resonate rather than which channels bring in new leads.
Total addressable market (TAM) is a buzzword that gets bandied about in boardrooms and pitch decks. Still, many people don’t fully grasp the width behind the addressable part of this term. To help you unpack just how vast your TAM might be, and what that means when gathering qualitative data, let’s start by defining TAM.
Your total addressable market consists of every area where there’s possible revenue.
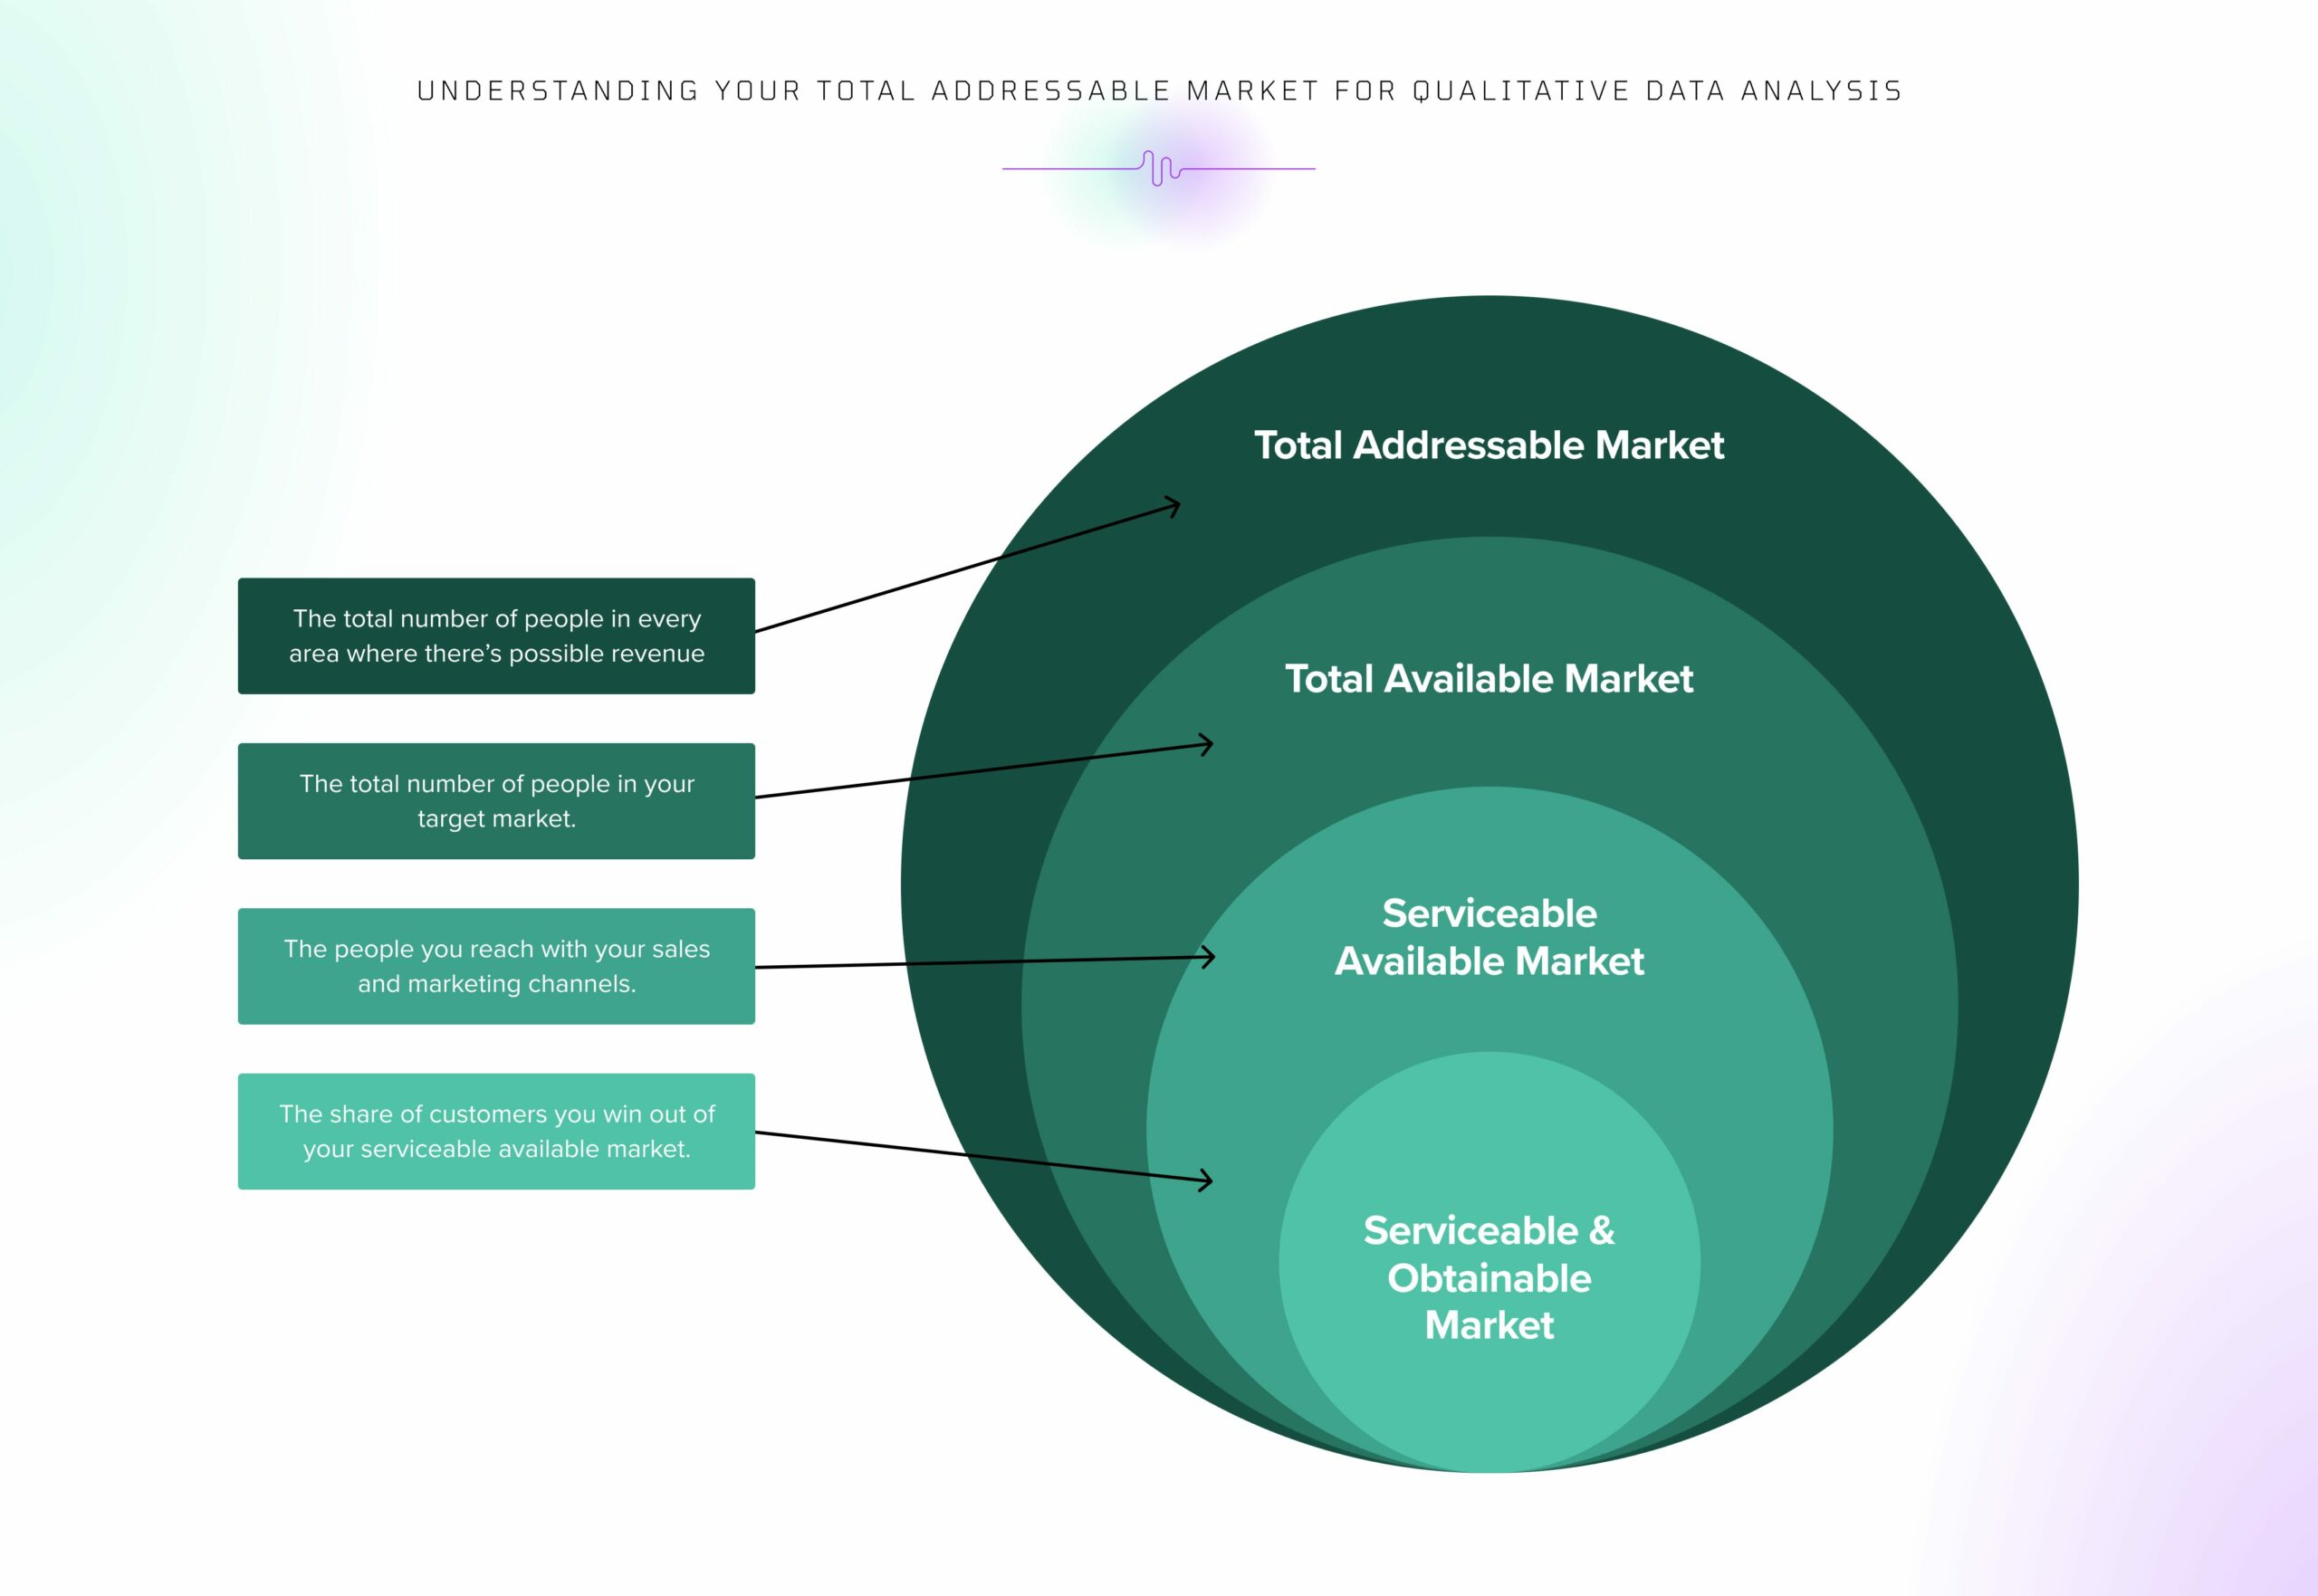
Where the buck stops with most people when reading this definition is thinking about the TAM via the lens of your industry. Take, for example, the fast food industry. If you’re McDonald’s, you might think of your TAM as anyone looking for a fast hamburger or chicken nugget fix, but there are far more people you could address beyond those who have a hankering for what’s on your menu. Some busy moms have two children in the backseat on the brink of a meltdown, and a quick stop into your playground might be the trick they need to avoid that chaos. Some people are simply hungry and consider more distant competitors, such as Chipotle or Firehouse Subs. Some shoppers are picking up Proctor and Gamble products at the local Target, who might not even have food on their mind yet.
The addressable part of TAM means the number of people who you can address with your products, and those are the consumers who have outside influences occupying their share of mind in the moments when they could be considering you, and share of wallet in their buying decisions.
There’s a vast pool of potential eyeballs waiting out there within reach, yet knowing how to address the wide swath of consumers who would ever be interested in your products can feel daunting. Where do you start? How do you tailor your product line to meet so many needs without becoming a ‘jack of all trades, master of none’? What type of messaging do you leverage to capture such a wide range of consumers potently? Answering these and a plethora of other questions requires that you have the right team assembled to put a qualitative data practice into effect.
How Employee Experience Impacts Your Total Addressable Market
One area of qualitative data analysis that’s not dug into often enough when discussing Total Addressable Market is employee experience (EX). Who you hire matters. These people will help steer your ship by making core strategic business decisions. The people you hire will interface with your clients, directly impacting your brand image. If your team’s experience on the job isn’t positive or engaging, you’ll struggle to align their experience with the customer experience (CX). In other words, knowing how your employees think, feel, and act in the workplace directly impacts your TAM because your employees shape how that market thinks, feels, and acts toward your brand. Their feelings will ultimately impact the end user experience through their interactions with your customer base.
As evidence, consider a recent Gartner survey that revealed 75% of CMOs were facing increased pressure to do more with less. The pressure to deliver better ROI has perhaps never been greater. While this pressure looms, only 11% of marketers surveyed in the 2024 CMO survey said their company is doing a very good job of leveraging data from marketing technologies for strategic decision-making, and only 6% said they’re doing very well at generating ROI from those marketing technologies.
Marketers want and need data to respond effectively to the world around them and the way their users think. Capturing those insights to reduce churn is difficult, especially as users and accounts stop engaging, or leave the company altogether.
Consider the differences between the experiences of a Target employee and a Walmart employee as evidence of how EX can influence your overall brand experience.

Both Target and Walmart sell many of the same product lines and SKUs. Still, the Target vs. Walmart employee experience tends to vary greatly, according to Glassdoor.com. When current and former employees were asked about various areas of the business, Target consistently outranked Walmart on Culture & Values, Diversity & Inclusion, Work-life Balance, Senior Management, and Compensation & Benefits. The only place that Walmart inched past Target was in Career Opportunities. Looking closer, you can see that Target has a higher CEO approval rating, higher rate of employees willing to recommend working there to a friend, and higher positive business outlook.
Having overall lower employee scores is a distinct challenge for Walmart. By not having employees who are excited about their jobs and connecting with customers across all layers of their organization, the customer’s experience will suffer. Interestingly enough, so will the quality of qualitative data analysis. That’s because when EX suffers, more employees seek recognition for their efforts. Rather than digging deeper into the consumer’s core needs, they approach qualitative data collection through the lens of self-actualizing their role. There’s less empathy for the consumer and more of a desire to make themselves look good in front of the managers, directors, or C Suite.
Getting the data needed to activate a plan that uses fewer resources and still generates high ROI is no easy feat, but it’s critical. These actions have a residual impact on companies at large. Getting to that level of understanding requires digging past the logical, linear thinking patterns and going toward emotive responses. But this is enormously difficult considering this finding from the world-famous behavioral scientist and economist Daniel Kahneman said:
”The only test of rationality is not whether a person’s beliefs and preferences are reasonable, but whether they are internally consistent.”
Kahneman was a psychologist, Nobel Prize winning economist, and author of the book, Thinking, Fast and Slow. Through his work, he debunked the idea that humans make rational decisions when spending money. Instead, they go after self-interest. That’s certainly true when teams within an organization end up working in silos, pursuing different goals or metrics than one another. Rather than working to uncover what’s happening in the market and taking a predictive stance on how consumers will behave, they look for ways to improve their own team’s success metrics. This siloed thinking can erode the employee experience and cause teams to work independently rather than collectively toward the organization’s North Star Metrics.
Modern businesses must look at a constellation of North Star metrics to truly understand which factors impact cost of acquisition (CAC) and lifetime value (LTV).

This deeper understanding is a must. Without having a variety of data sources to pull from, both quantitative and qualitative, you won’t be able to see the volatility across those numbers and understand how outside sources could impact your organization. It’s not about trying a new campaign or launching a new promo. It’s about tracking what’s going on outside of the business and inside the business by tracking these metrics over time.
Getting the right insights requires organizations to have a single source of truth within the data to be able to answer questions about why there’s a shift in consumer behavior.
That single source of truth is your North Star Metric. Our co-founder, Buckley Barlow, has already done a post going in-depth on what a proper North Star Metric looks like. Squirrel that article away for future reading. For the sake of this post on qualitative data, know this — having a single source of truth that taps into the constellation of North Star Metrics helps your team know where to most effectively spend their time so they can do more with less and deliver higher ROI on campaigns. Without being forward-thinking and putting a qualitative data practice into place now, you’ll continue relying on lagging indicators, resulting in knee-jerk reactions rather than insightful decisions. The North Star Metric helps teams navigate the right next steps for your organization to shift your goals. In doing so, employee experience (EX) improves because teams feel they contribute to the organization’s success.
Having overall lower employee scores is a distinct challenge for Walmart. By not having employees who are excited about their jobs and connecting with customers across all layers of their organization, the customer’s experience will suffer. Interestingly enough, so will the quality of qualitative data analysis. That’s because when EX suffers, more employees seek recognition for their efforts. Rather than digging deeper into the consumer’s core needs, they approach qualitative data collection through the lens of self-actualizing their role. There’s less empathy for the consumer and more of a desire to make themselves look good in front of the managers, directors, or C Suite.
Properly democratizing all insights gathered through qualitative data analysis across the organization keeps teams in sync and aligned with the market. However, focus too much on attribution errors around where leads come from and which departments get the credit for the revenue brought in rather than getting to know your customers, and you’ll lose every time. Your team will get hyper-focused on themselves and lose sight of the humanity behind the brand experience.
This hyper-focus becomes even more of a problem when your employees start grumbling to their spouses when they get home or chatting around the water cooler about being unhappy. Fostering a healthy employee experience is not just about keeping your team feeling good about their work. It’s about inspiring an open line of communication among your team members so they know there’s a two-way trust to share qualitative data.
A great example of this comes from Enterprise Rent-A-Car, a company which cultivates an open communication line. Take a look at what the Executive Chairman of Enterprise Holdings says about why this open dialogue is so critical:
“We have this belief at the corporate office that the best ideas come from the field, where people are interfacing with customers every day. It’s another reason we start everybody at the bottom. Frankly, we have our best ideas coming from the field now every day.”
This isn’t just a talking point, though. The famous Enterprise Rent-A-Car slogan, “We’ll pick you up” came from the field.Someone in a branch came up with the idea after hearing renters consistently ask for a ride into their branch. Had the field employee not felt empowered to share that qualitative feedback with the corporate office, the slogan never would have come to light.
If employees don’t think that higher-ups care about their well-being and instead care only about making money, they won’t offer up the qualitative data and insights needed to grow. That misalignment can make employees feel like a cog in the system, creating a disengaged workforce. These trends won’t be broadcast loudly, either.

A recent Gallup survey found that quiet quitting is real, with over 50% of the workforce backing away slowly from their job. With only 32% of the workforce engaged and 18% actively disengaged, there is a huge middle ground of workers stuck in the gray area, showing up for the job but not emotionally investing themselves in the success of the brands they work for. Policies won’t break this trend. It’s up to leadership to take proactive steps to re-engage their team.
Ongoing and intentional conversations with employees, starting with management and moving throughout the organizational chart, allow the C-Suite and Directors to gather valuable qualitative data in more of a real-time capacity. Meetings with management is a great place to start. Not only do these conversations re-engage managers so they can re-engage their teams, but they also allow key decision-makers to understand the conversations happening at the ground level. When regular accountability and performance reviews are held, managers can capture that data and feedback from their team while simultaneously reminding them of expectations for their role in the organization. But this data collection doesn’t have to be so formal. Taking teams out for lunch, joining teams around the water cooler, or intentionally scheduling team-building activities allows employees to feel part of something bigger while also opening up more about what’s happening on the job.
Bolstering the employee experience by understanding what’s happening throughout the organization can shape the organization’s trajectory by going deeper with the cohorts they serve.
Think Cohorts Over Personas
Buyer personas present an inherent challenge. Teams often approach these exercises through a self-reflecting lens, focusing more on attribution than contribution. Marketing teams seeking attribution for their messages only look to the specific personas they’ve addressed. Sales teams seeking attribution look at the personas they’ve had the biggest luck closing. While this approach makes sense on the surface, it can also lead to team members letting their personal goals drive decision-making, leaving behind a huge swath of untapped potential in the market.
In addition, many teams maintain a hyper-focus on specific channels. Rather than looking at which messages resonate best, teams look at which platforms convert leads into buyers most effectively. While that’s important data to collect and understand, it fails to acknowledge the nuanced experience across various channels and platforms that leads up to the purchase decision.
Singular focuses keep organizations from tapping into emerging markets, markets with unmet needs, and fresh new customer potential. We opt for a cohort-based approach to break free from that relentless focus on singular personas.

Cohorts are a group of personas who share a particular experience or event and behaviors, many of whom might overlap various market segments. However, they are targeted as a single group because of shared criteria. This shared criteria spanning multiple personas and segments allows brands to reach more people with mass marketing while elevating the persona-based approach.
Let’s look at the insurance industry as an example. Many personas need insurance to keep themselves safe against unknown threats. While various people need this service, they can all fit inside a single cohort. That’s because they all have a shared underlying root emotion — fear. Fear of the unknown. Fear of loss. Fear of harm. Fear that when they go outside, something bad will happen.
Allstate Insurance does an excellent job with targeting various cohorts using the same underlying emotion of fear. With one campaign, they use Mayhem to showcase how life can happen in a variety of unforeseen circumstances, typically relating to what’s happening on the macroeconomic backdrop at the time. For example, during summer, the commercial aligns with summer travel. If you’re not familiar, here’s an example of a Mayhem commercial.
During football season, Mayhem usually occurs at tailgate parties and during basketball season, Mayhem often occurs during March Madness celebrations. While this wild scenario is fun, Allstate Insurance also has another cohort they target — a cohort who wants protection against the unknown. This cohort has been at their core for 70 years and has an interesting backstory to their famous “good hands” slogan. The campaigns that use this slogan soften the cohort’s concerns with the phrase, “You’re in good hands” showing the buyer that they’ll be taken care of from simpler switching to Allstate and through to anytime trouble arises and they need their insurance to protect them.
With this slogan, the buyer feels protected. With the Mayhem slogan, they feel liberated. Still with all of the cohorts Allstate targets, the core emotion doesn’t shift — fear. Each cohort will resonate with the idea of reducing fear regardless of their lifestyle.
Understanding of your cohort’s shared criteria comes from qualitative research. By tapping into the reasoning behind every purchase decision, brands can transcend personas and markets based on emotions. By analyzing qualitative data, teams can unite personas around a common value and purpose. Or, as Simon Sinek famously said:
“People don’t buy what you do; they buy why you do it.”
You don’t have to boil the ocean by trying to be everything to everyone. Qualitative data can uncover what ties your people into one cohort. Rather than fragmenting the brand through persona-based silos, you can empower others through a common thread that brings people together. Once you uncover this emotive thread, you can then start solving for that feeling through various persona-based messages. Take a look at how Nike has done this well.

Nike happens to sell fitness products, but their brand’s messaging isn’t about the stuff. It taps into people’s aspirational side. These people want to be in a community of others striving to be their best selves. In doing so, their messaging tugs at this emotional string in various ways. Runners, tennis players, and basketball players all wear Nikes. So do soccer moms, amateur athletes, and athleisure wear lovers. Everyone leads a different lifestyle, yet everyone Nike targets via their marketing is connected to the feeling of being up against something big.
As a reminder, buyer personas look at potential individual customers, whereas cohorts are broader, looking at the overlapping qualities across various personas within a shared experience or event. There can be numerous personas within one cohort, as can be seen from the Nike ad above. The organization’s onus is on uncovering the shared criteria. The challenge is that often, the buyers themselves don’t recognize the stream of thoughts in their subconscious. Through qualitative data analysis of cohorts, enterprises can unpack what inspires a person to take action versus what gets ignored in marketing.
Considering the difference between high-level buyer personas and cohorts, it’s time to start peeling back the layers of what’s happening within your market and your customers’ experience. Leveraging in-depth cohort analytics is best for this.

Cohort analytics is an analytical method that pinpoints the exact moment customers experience the emotional and logical triggers that move them through the customer journey. Knowing these moments can help you widen your TAM by understanding what’s really happening between the ears of potential buyers. Not only do you see when the consumer takes action, but you also see when a customer stops taking action, which can tell you much about what’s missing from your product suite, marketing, or experience. In spotting these precise moments of reckoning, you can make critical decisions faster and more accurately.
If you’re unfamiliar with cohort analytics, we encourage you to brush up on this data collection methodology. While you might not need to know specifically how it’s done, depending on your role, everyone must understand what this methodology shows us.
Cohort analytics is technically quantitative data because you have actual numerical data attached to it. Still, those facts and figures are all tied directly to consumer behavior. Having this insight can validate the other types of qualitative data you receive, helping you get to know your customers, helping to speed your time to insight by knowing where to look for problems along the buyer’s journey and using qualitative data analysis to avoid playing a guessing game around what went right or wrong. For example, by looking at sales messages sent out with a specific campaign that triggered a swell in purchases, you can better understand what triggered the customer to take action at that exact moment in their journey. This gives you a strong starting point to pair contextual data with what you’re gathering qualitatively. As you peel back the layers and move into the emotional and logical drivers behind your customer’s data, you can go deeper with your analysis and get into the primal drivers for your total addressable market.
While watching trends through qualitative data can yield smaller findings, like why a specific campaign caused a drop in subscribers, a bigger issue is at stake here.
As an enterprise, you must remember that although you might be king today, you won’t be king forever.
Paying attention to qualitative data analytics primes the brand to avoid attrition and remain competitive. Actively monitoring trends and mitigating frustrating moments for your customers helps your brand stay relevant and understand the sentiments driving your brand’s growth.
To paint a picture of how assumptions can vary wildly from what’s really happening inside of a buyer’s mind, causing an organization to become irrelevant and lose touch with the market, consider the study of why images of clouds get people to buy more expensive couches instead of images of coins.
In this study, a furniture store tested two types of imagery on their homepage — coins and clouds. The goal was to get their cohort of buyers to keep researching the furniture they had in stock. When coins were displayed on the homepage, visitors searched more based on price and ultimately purchased inexpensive pieces of furniture. Conversely, when the store displayed clouds on the homepage, visitors looked more for comfort while researching the furniture in stock. That’s because clouds made visitors think subconsciously about the shared criteria that mattered — feeling good about the furniture they kept in their homes. As a result, visitors ultimately purchased more furniture with higher comfort ratings.
Your buyer’s subconscious is rich with insights around what they prioritize, what’s important to them when researching your products, and what emotional and logical triggers will ultimately get them to buy.
Comfort and price are two elements valued by a variety of personas but can be shared by one cohort. Knowing that shared value for your brand allows you to steer a mass group of people in the same direction and ultimately boost your revenues.
We recently conducted our own case study to validate this study by retrospectively reviewing the mattress brand Purple. After seeing Purple Innovation’s sales revenues decline from $726.23 million in 2021 to $575.69 million in 2022, and a projected decline for 2023, our goal was to uncover where in their company journey they stopped resonating as strongly with their cohort of customers. What we found about this previously dominant company was alarming.
If you’re unfamiliar with the company Purple, they hit the mattress scene with a force with their Goldilocks ad.
This ad proved powerful as a stand-out unique message compared to other ads on the market. Through a mix of comedy and connection, Purple skyrocketed in growth in 2016. But by not adequately tracking qualitative data, that seeming hockey stick-style growth quickly changed.

While Purple did an excellent job aligning consumer expectations with their product, they began ignoring cues they would have seen from proper qualitative data analysis as they evolved. These cues included their cohort’s preference for comfort over price, convenience over mass-store shopping, and innovative technology over average design.
As Purple evolved from an online retailer focusing on comfort and innovation over mass production, they lost touch with the insights from the market that initially set them apart. In the backdrop to their success were other mattress companies entering the market and other innovations. While the team might have thought they were expanding into new markets and targeting their TAM, they lost touch with their cohort’s shared criteria for a purchase decision. Over time, their growth plateaued before eventually starting a downward trend.
Too often, organizations that come out of the gates with gusto end up focusing on surface-level qualitative data to get answers and get back on track, but there are two problems with this approach:
- High-level insights aren’t enough to make core business decisions.
- Deeper analysis takes too long to unpack and draw out meaningful insights
Often, that gusto pays off in the beginning but fizzles because of a failure to address the primal drivers of their TAM.
Getting to the Primal Drivers of Your Total Addressable Market With Qualitative Data Analysis
If you took a psychology class in college, chances are you were taught Maslow’s Hierarchy of Needs. Maslow’s pyramid defines humans’ core needs to live healthy lives.

At the bottom of the pyramid, you’ll see the basic needs of food, water, and shelter. These are what’s needed to survive in the wild. Above that are the basic needs of security, health, and finances needed to survive in today’s world. The biological and safety levels are important, but they do not inspire someone to take action. As you move up the pyramid, once the foundational and logical needs are met, you’ll notice that people need much more. It’s those needs that drive modern consumers to take action.
To paint a picture of what it looks like when brands understand these psychological and self-fulfillment needs, look at how Tinder, a dating app, teamed up with Peacock, a streaming service. These two brands brought their TAM together via a common core ‘why’ to what they wanted the most — connection. With the TAM in mind, Peacock and Tinder worked collaboratively to break out one of their target cohorts — people in the dating pool. Focused in on this cohort, Peacock and Tinder were able to identify new ways daters sought connection. For years, the entertainment industry and dating apps thought romantic comedies were the preferred movie choice for connecting on a date. However, their study determined that horror movies were the new dating trend.

Respondents in the study said that watching a scary movie led to more opportunities to cuddle (51%), added date night excitement (46%), and an unconventional way of breaking the ice (43%). Tinder confirmed the new dating trend through their qualitative data that spotted spikes in the keywords “scary movie” (+42%) and “spooky movie” (+204%) in the profile bios during October.
The desire to view those movies alongside someone else led to two major takeaways for the apps — advertising to singles who are watching horror movies alone yielded better results for Tinder, and targeting those connections in the app with a cue to have a date night in front of a horror movie yielded better results for Peacock.
Addressing relevant emotional and logical triggers among your consumer base in your marketing requires strong alignment between two core elements — your company’s why and the consumer’s emotional and logical triggers. In our humble opinion, determining how to drive the brand and customer experiences closer together is best done by leveraging our framework, StoryVesting™.

The StoryVesting™ framework was originally developed by our co-founder, Buckley Barlow. We’ve gone into the nuances and depth behind this framework in a post on how we approach any level of business transformation that’s worth reading.
The alignment and concentric layers within each brand experience and customer experience drive decision-making. When taking into account how many personas are inside each cohort, and how many cohorts each organization addresses inside of the TAM, it’s imperative to adjust how you’re leveraging the StoryVesting™ framework. are inside each. While the foundation remains the same, approaching StoryVesting™ will uncover the primal drivers of the TAM from across a variety of cohorts.

In this image, you can see how we peel back the layers of each cohort and get to the shared identity in the middle. By starting with the many values and belief systems, going deeper into analyzing affirming statements, and then nailing the core traits around the horn, we can get to the collective identity of our TAM.
This identity isn’t just internal. It’s also impacted by external forces, such as the macroeconomic backdrop, election cycles, world events, and more. By understanding how organic and synthetic stimuli impact decision-making, enterprises can adjust how they create and market their products.
A good example of this is from the insurance industry. When disaster strikes, whether manmade or natural, people become more afraid of what could happen to them. That fear and emotional response correlates with their core why and their core identity. Parents’ want to protect their children. Children want to protect aging family members. Entrepreneurs want to protect their livelihood. The list goes on. This identity of protector sparks an inherent desire to seek out ways to shield themselves and their loved ones from more pain in case of an emergency. Understanding a desire for any product requires understanding the core why behind what’s really being purchased. In insurance, fear leads to looking for a sense of security. That’s where StoryVesting™ comes back into focus.
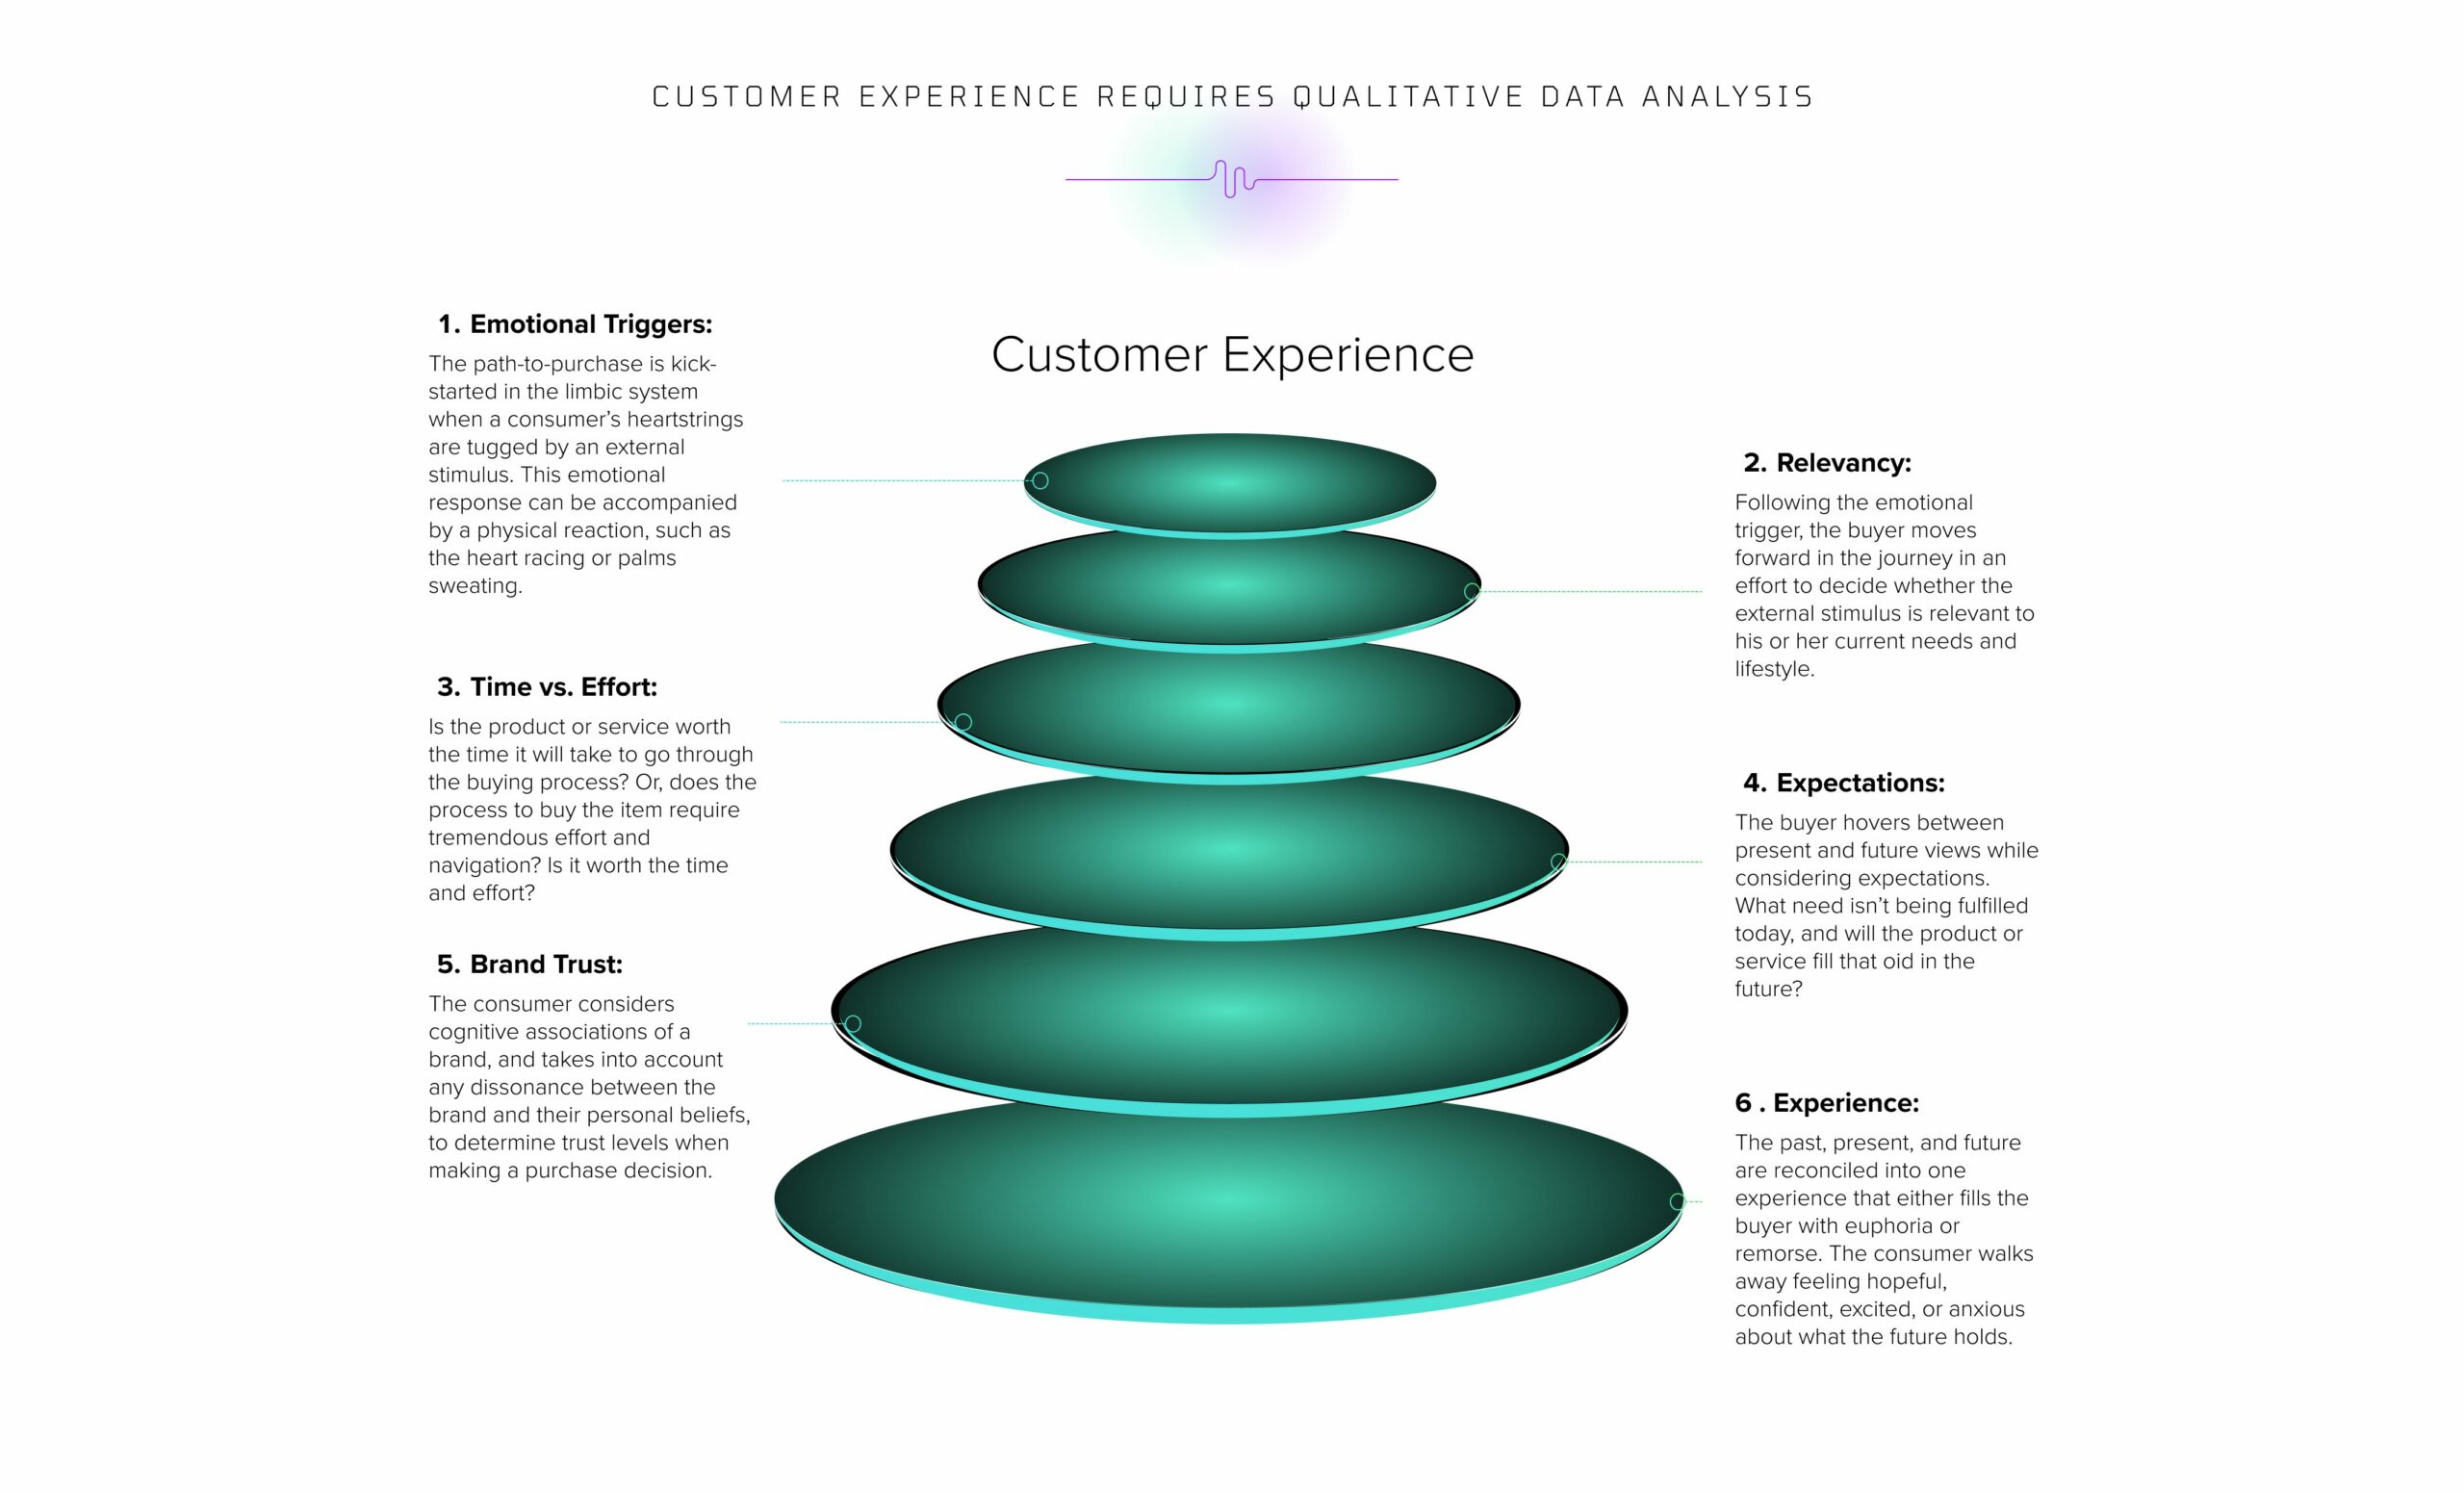
On the CX side of the StoryVesting™ framework, you can see that everything starts with the core why. When your TAM decides which companies to buy from, where to eat, and how to spend their hard-earned cash, they start with an emotional trigger stemming from their core identity, and then move quickly into logical reasoning to make their decisions before reconciling the two during the transaction.
Bringing back the insurance industry, let’s look at the protectors who want more security over their loved ones and belongings. When a world event occurs, they’re inclined to see the risk in front of them, triggering their emotional response of fear that they’re not as protected as they once thought. From there, they’ll move to logical reasoning.
- What are relevant solutions to this fear?
- What is the time versus the effort of getting protection to solve this worry?
- What type of expectations do they have around the insurance they’re acquiring?
- How much do they trust the brands they’re considering?
Once decided, the emotional and logical needs will be reconciled into one layer as they decide whether the protection method of their choice was adequate and will do the job.
What’s important to remember as you look at your TAM is that this core reason often shifts based on milestones in a person’s life. For example, young adults entering college need very different things to be happy than newlywed couples getting ready to welcome a baby into their family. The speed at which this core why changes is more rapid than many realize, so staying on top of various cohorts and their emotional needs is crucial. Leveraging a framework like StoryVesting™ to maintain awareness among your TAM equips you to marry the business’s core why and the customer’s core desires, identity, and attention.
Bringing these triggers together with the brand’s experience is necessary for organizations to address their TAM. In understanding the triggers across multiple markets that need the product or service in question, enterprises can better align their product suite, marketing campaigns, and customer experience. These organizations will ultimately not only tap into a new market. They will also:
- Reduce customer acquisition costs
- Increase brand awareness
- Improve cognitive associations of the brand
- Improve customer experience
- Improve employee experience
- Increase retention
- Increase lifetime value
Addressing TAM isn’t about creating a new buyer persona or two. It’s about understanding the cohorts of buyers you’re targeting. This understanding requires marketers take an empathetic stance to the market and traversing the many whys across groups of cohorts — something that requires an enormous amount of data.
Context will inform the prediction every time, yet context from Wikipedia alone isn’t enough. Instead, you need proper qualitative data analysis to refine your knowledge into something usable.
Generative artificial intelligence (AI) can speed up the time to gain insight.
Earlier in this post, we discussed the importance of organizations having LLMs to train generative artificial intelligence (AI) with the abundant amount of qualitative data being gathered by the organization when a proper qualitative data practice is in place. With this technology, organizations are better equipped to get deeper and faster analysis of the data already available, allowing teams access to understanding the primal drivers of their markets and users.
Generative AI and Qualitative Data Speed Up the Time to Insights and ROI
Without question, generative artificial intelligence (AI) has caught the business world by storm. The influx of AI tools has spurred many organizations to jump in without really knowing what they need or having a strategy behind how to leverage this technology for maximum results. Maximizing budgets on AI isn’t quite as simple as engineering a few ChatGPT prompts.
If your business already is not operating in the right context, AI isn’t going to solve challenges like increasing ROI on campaigns, lowering churn rates, and gaining market share for you— because it doesn’t know your business model, or your metrics, by itself.
Given the splashy headlines you’ll see today about AI, it’s normal for teams to want to jump right into what’s available to gather insights about the market. Equally normal are the fears that are often brought up as a result of headlines surrounding the idea that generative AI could cause jobs to be taken from people and given instead to platforms. However, research shows that as AI adoption increases, AI-related job cuts are minimal compared to other factors.

Understanding the approach behind why generative AI is being used to gather better insights from qualitative data can help avoid teams to pulling generalized ideas from echo chambers like ChatGPT. Instead, teams can understand the importance of extracting insights from data that’s been properly collected without fearing for their job security, improving their overall employee experience.
The more insightful approach to tapping into generative AI to draw insights from qualitative data requires multimodal AI, multimodal large language models (LLMs), and other capabilities within AI. Here’s why.
Generative AI is only as effective at finding key business insights as what information it’s fed.
Getting these insights isn’t about going after a platform. It’s about going after the cohorts and learning what they think so that you can get closer to aligning with their needs. Without starting with qualitative data that are properly structured and categorized, you’ll only accelerate your way to failure. Rather than driving, you’ll take an airplane to the wrong destination.
ChatGPT is fed every piece of data on the Internet. Effective LLMs in enterprises require that teams be aware of the data being analyzed and confident that the data from which the insights are derived is clean, accurate, and relevant to the organization’s needs.
This is where all AI initiatives are now at risk. Not only do you have to protect your data, but you also need to capture the right data to allow AI to deliver the right insights. Automating a broken process adds more pain and frustration — especially if that process is one that cannot be done manually.
And therein lies the biggest challenge with using generative AI to speed up time to insights — you must have proper data collection methodologies to capture the right data before learning from it. Even then, AI alone might find important information, but if you’re not far enough along in your maturity model, it might not allow you to extract the right insights to solve all of your problems.
Tapping into AI to start and enhance your qualitative data practice requires you to know proper qualitative data collection, your TAM, and how to properly categorize the qualitative data points — all of which we’ve already covered in this post. Then, with that foundation laid, you can feed what you’ve collected more accurately into a private LLM, fine-tuning the data via chain learning.
Better inputs give better outputs.
Generative AI will deliver different results based on the context and data of the algorithms being served. Ensuring you have the highest quality and most accurate qualitative data categorized effectively means you will get better insights faster.
But what happens when you get the insights needed? How do you leverage those insights for growth so that you can continue the upward momentum? It’s not enough to have the insights at your disposal. You must also activate the data and findings to grow your organization.
Activating Your Qualitative Data for Faster Business Impact
Once you’ve established a strong qualitative data practice, fed that data accurately into a private LLM, and tapped into emerging technologies like generative AI, you can expand your awareness about what the market needs. But awareness alone isn’t enough to create a sound strategy.
As an organization, tapping into emerging technologies and qualitative data to add color to the otherwise black-and-white picture presented by quantitative data alone is a non-negotiable. The real nuggets of wisdom come from strong qualitative data practices that answer what emotional triggers will get them to take action, the cognitive process they traverse to make purchase decisions, and the emotional needs that must be met to become brand loyal.
It’s hard to enter a crowded market or to rise above the noise. Yet some companies do this exceptionally well at every stage of the StoryVesting framework.
Here, you can see several examples of companies that have stood out among their markets by tapping into qualitative data to align more closely with their consumers. While we could go in-depth on each of these, and our co-founder Buckley Barlow has unpacked all the many nuances of the StoryVesting framework in his post, let’s focus on the company we started this post referencing—Apple.
Apple has always been a brand filled with products that are similar to others in the market. Computers weren’t new when Apple started building them. Palm had their handwriting product when they came out with the Apple pen. MP3 players existed before the iPod. Still, Apple has maintained a cult-like following because they have dug deeper into their customer’s why and how their users experience each of their products. In doing so and continuing to gather qualitative data internally and externally, they continue to dominate the tech space, cultivating a loyal base of customers.
Gathering qualitative data is only the first step. Gaining access to your insights quickly isn’t a silver bullet to growth. Without a proper framework to infuse your findings with every layer of your business, you’ll be challenged to create a loyal base of buyers to build retention and continue moving up the S Curve of Growth. That requires your organization to move from No Man’s Land in a buyer’s mind to a feeling of Brand Euphoria — a shift that requires the activation of your qualitative data insights.
Brand euphoria occurs when organizations have leveraged qualitative insights to establish deep cognitive associations with the brand. Think, Apple. As we discussed above, Apple found ways to develop immersive, customer-centric experiences that are both easy to understand and hard to leave behind once you have them. This alignment between the brand and customer experience builds long-lasting ROI, more impactful campaigns, and lower churn rates.
Going back to our StoryVesting™ framework, here’s how that alignment occurs by drawing the insights found in qualitative data.
You don’t have years to align your brand with the customer to move from No Man’s Land to Brand Euphoria. The pressure is on to quickly and methodically bring together your organization’s why, business model, people, processes, platforms, products and services, channels, and experience with your customer’s emotional why to continue growing profits and capturing market share. The only way to get to the root of that alignment is by tapping into your qualitative data and establishing a single source of truth that will let you uncover the nuanced ways to bring these two concentric circles closer together.
But here’s the catch — consumers are inherently skeptical. Modern buyers need more from brands to establish trust and make a more human connection in an otherwise digital world. Qualitative data allows you to tap into ways to educate without feeling like you’re just scratching the surface. These insights allow you to honor the human experience, understand the context, and use those emotions to put your business offerings and messaging closer to your buyer’s needs to survive or thrive. These strategic communications let you build relationships and market in a way that doesn’t feel like a one-night stand. This is what we call the law of exposure.

The law of exposure states that what people think about and expose themselves to, they become. For marketers, the messages and promises you expose your audience to matter; however, if they don’t align with the experience they receive, you’ll erode the experience and lose the customer’s trust. It takes time to build trust and even longer to repair trust, so when your qualitative data analysis sends you down the wrong path, you could lose attention, and thus, market share — and fast.
Qualitative Data is Your Key to Rising Above the Noise
There’s a lot we’ve unpacked in this post. Hopefully, by now, your head is spinning with the possibilities for you and your team as you navigate the nuances of your qualitative data analytics. Here are a few questions for you to take into your next team meeting to consider:
- What does our current qualitative practice look like? Do we have one? Is it strong enough for what we need?
- How is our team leveraging qualitative data in decision-making?
- What business forces are impacting your CAC and stock price daily?
As you sit around the board room discussing these questions and any others that popped up for you throughout the reading, remember this — success isn’t driven by platforms or AI. It’s driven by market forces and how consumers interact with the world around them.
Driving alignment between your brand and the market requires you to understand what’s going on in the minds of your people, both internally and externally. That understanding doesn’t come from a handful of annual surveys and NPS scores at the bottom of transactional emails. It comes from focusing on TAM.
That focus is where large language models have changed the game. By training a private LLM on your market, rich with context and cognitive associations of your brand, you equip your team to quickly and effectively answer the questions above and make more sound business decisions based on qualitative data analytics.
Are you ready to explore how you can infuse these strategies into your organization? Let’s talk. We meet with enterprises daily to create sound business strategies by tapping into the StoryVesting framework and leveraging data to cut through the market noise. If you’re unsure where to start or how to bring these new ideas to your team, we’d love to talk to you, too. Schedule a 15-minute consultation to uncover how we can help you gather the potent insights needed via qualitative data.
Schedule a Discovery Call